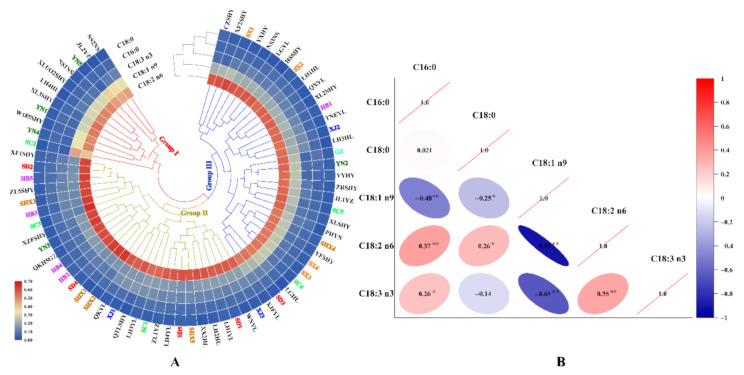
Figure 3.
Cluster heat map of different walnuts (A) and correlation analysis between each fatty acid (B). Codes with the same colour represent samples that belong to the same producing area, and codes with black colour represent the known species; * represents medium correlation (p < 0.05); ** represents strong correlation (p < 0.01); C16:0, palmitic acid; C18:0, stearic acid; C18:1 n9, oleic acid; C18:2 n6, linoleic acid; C18:3 n3, linolenic acid.

