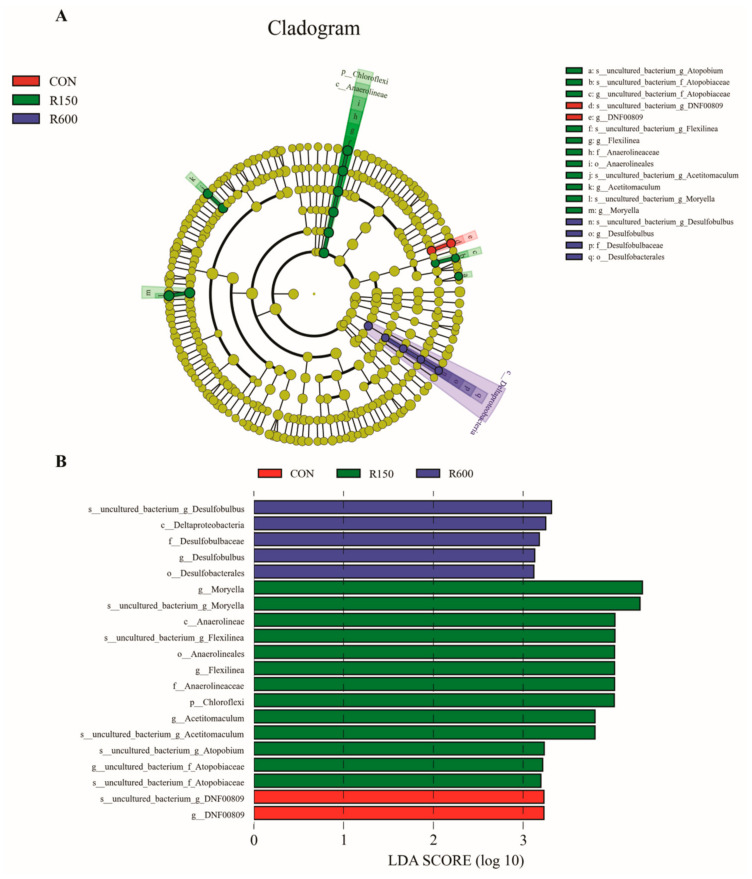
Figure 4.
The LDA effect size (LEfSe) analysis of ruminal bacterial taxa affected by dietary resveratrol supplementation in fattening goats. (A) Cladogram displays significantly enriched bacterial taxa (from the class to the species level). (B) Bar chart displays LDA scores for different treatments. Different colors represent particular bacterial taxa that were enriched in the different groups. Significant differences are defined as p < 0.05 and LDA score >3.0. There were no biomarkers with statistical differences in the 300 mg/kg RES group. CON, the control group; R150, the 150 mg/kg RES group; R300, the 300 mg/kg RES group; R600, the 600 mg/kg RES group.

