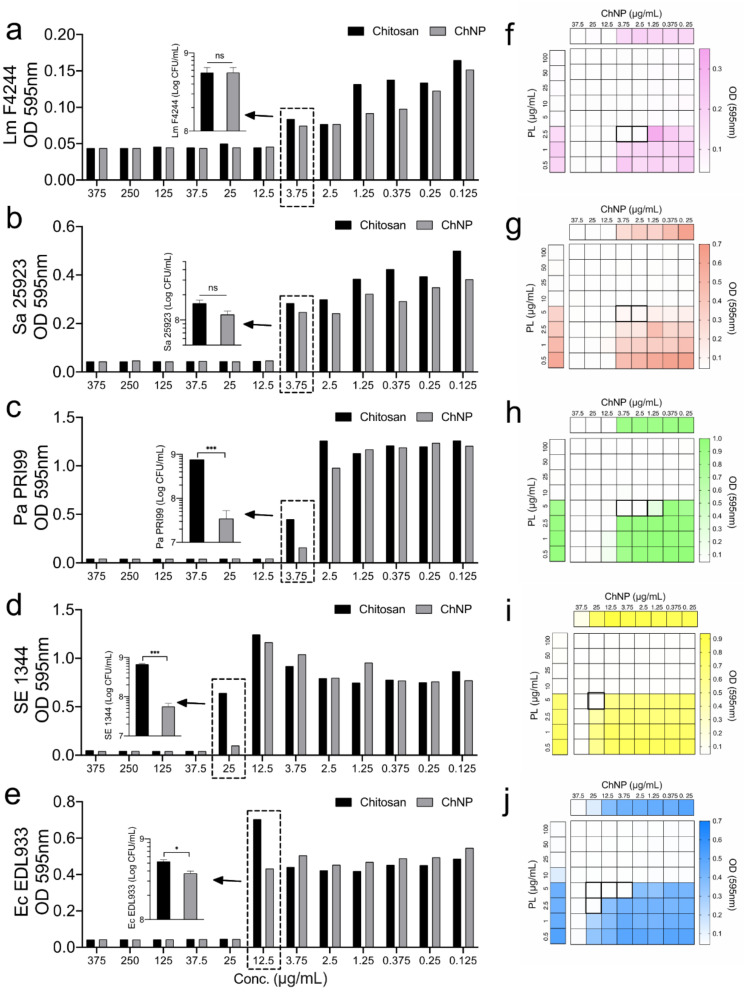
Figure 2.
Comparison of the minimal inhibitory concentration (MIC) of chitosan and chitosan nanoparticles (ChNP) on (a) L. monocytogenes F4244 (Lm), (b) S. aureus ATCC25923 (Sa), (c) P. aeruginosa PRI99 (Pa), (d) S. Enteritidis 13ENT1344 (SE), and (e) E. coli EDL933 (Ec) in Mueller Hinton Broth (MHB). Synergistic MIC of ChNP and PL on (f) L. monocytogenes F4244, (g) S. aureus ATCC25923, (h) P. aeruginosa PRI99, (i) S. Enteritidis 13ENT1344, and (j) E. coli EDL933 was lower than the individual MIC of ChNP or PL. The boxes with bold boundaries indicate the reduced concentration of ChNP and PL when they act synergistically to the pathogens. A pairwise Student’s t-test was used for statistical analysis. * p < 0.05, *** p < 0.0005, ns, non significant.

