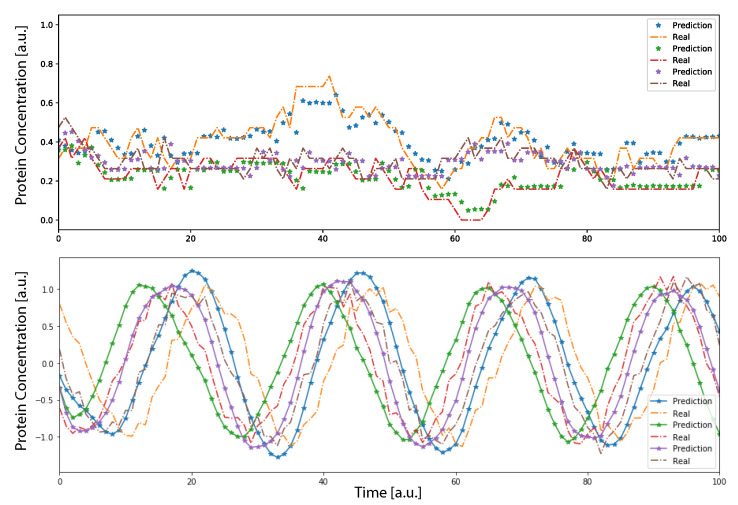
Figure 2.
Gene regulatory network dynamic with genes. The dynamic was generated using a random interaction matrix . The top panel shows the continuous time trace of proteins concentration for a random GRN with . The bottom panel shows the oscillatory dynamic of 3 genes relative to the core clock of an oscillatory network. In both panels, dots show the prediction of the neural network implemented using the first time points and then letting the system evolve on its own. The stochastic data were generated using the Gillespie algorithm.

