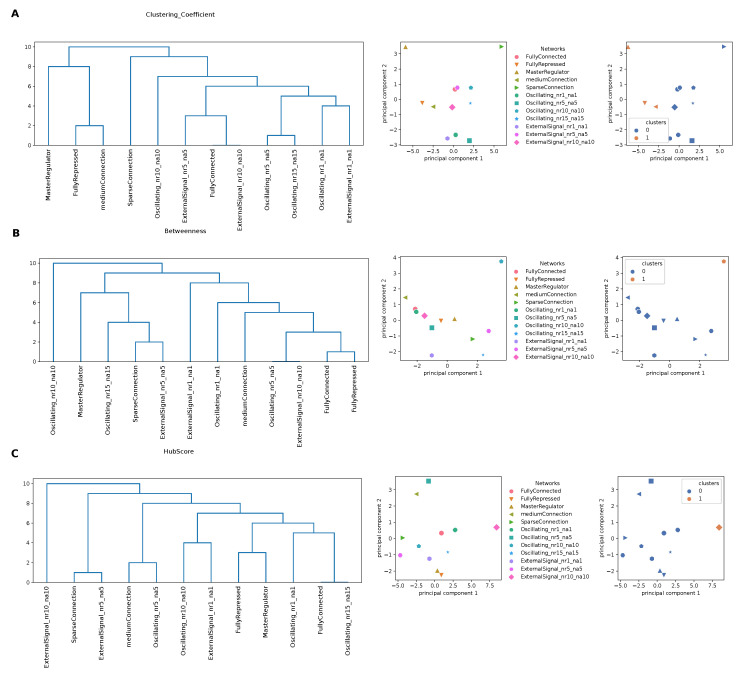
Figure 5.
Clustering based on the network properties of the input attention matrices. We show the dendrograms obtained from a hierarchical clustering (left), a PCA plot showing the 12 gene regulatory networks used (centre) and the obtained partition in groups (right) for the clustering coefficient (A), betweenness (B) and hub score (C).

