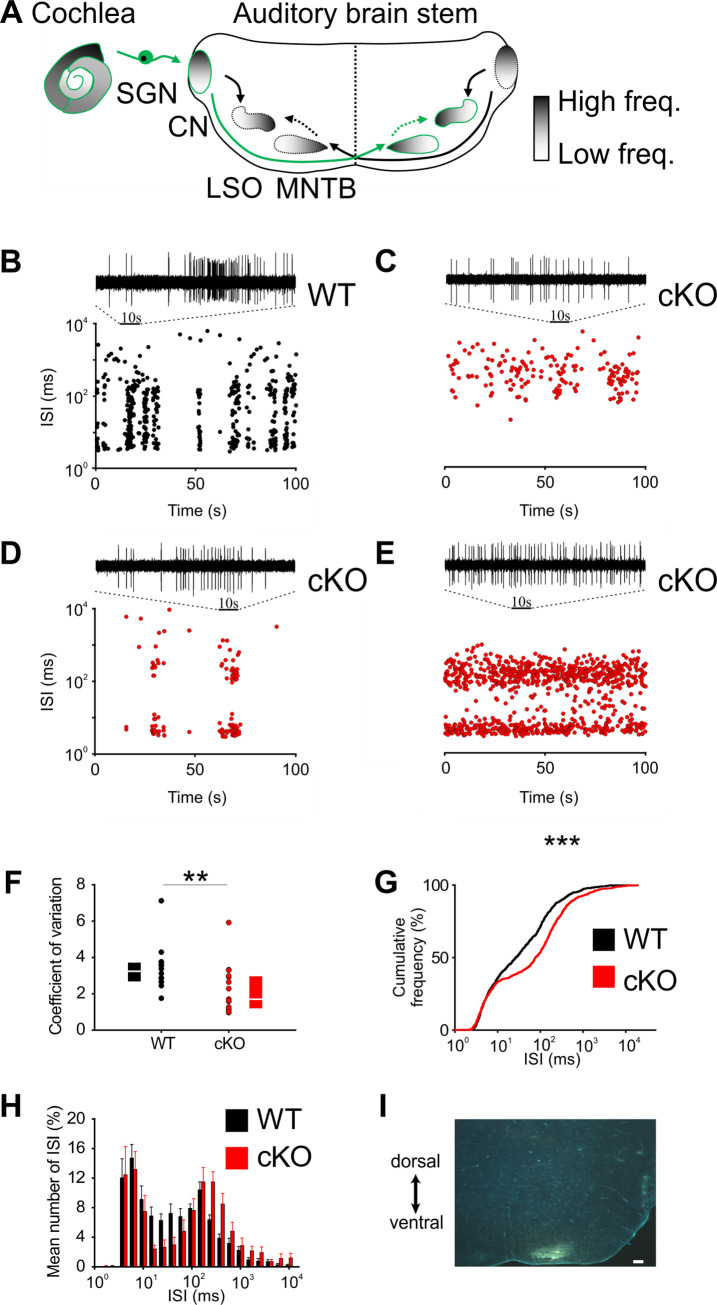
Figure 2. Disruption of Kölliker’s organ activity changes prehearing burst firing of medial nucleus of the trapezoid body (MNTB) neurons in vivo.
(A) Simplified model of auditory connections in the brainstem. The pathways relevant for this experiment are marked in green. Inhibitory pathways are indicated by dotted arrows. CN, cochlear nucleus; LSO, lateral superior olive; SGN, spiral ganglion neurons. (B–E) Patterns of spontaneous discharge activity from individual MNTB neurons recorded from mice before hearing onset (P8) in wildtype and cKO littermates. Dotplot graphs show respective interspike interval (ISI) distributions for 100 s of spontaneous discharge activity. On top of each dotplot raster is a 10 s period of original spike trains. Note that the wildtype MNTB neuron shows prominent burst firing, which is either strongly reduced (D) or absent in cKO mice (C, E). (F) Quantification of spike bursting patterns by calculating the coefficient of variation of ISIs yields significant differences between wildtype (n = 14) and cKO units (n = 15) (Mann–Whitney rank-sum test: p=0.006); also shown are boxplots indicating medians and 25% and 75% quartiles. (G) The mean cumulative distribution of ISIs reveals the significant shift toward larger values in cKO mice (wildtype n = 14 and cKO n = 15; Kolmogorov–Smirnov test: p=0.0008, D = 0.19), with the median ISI increasing from 26.9 ms in wildtype to 76.3 ms in cKO mice. (H) The overlaid log-binned histogram compares the distribution of ISIs between wildtype and cKO mice. Values represent mean ± SEM (n = 14 wildtype, n = 15 cKO [P8]). For statistical analysis, the chi-square test was used (see Supplementary file 1a for p-values). (I) Iontophoretic injection with Fluorogold verifies recording site from in vivo juxtacellular voltage recordings from MNTB neurons in a prehearing wildtype mouse (P8). Scale bar 200 μm.
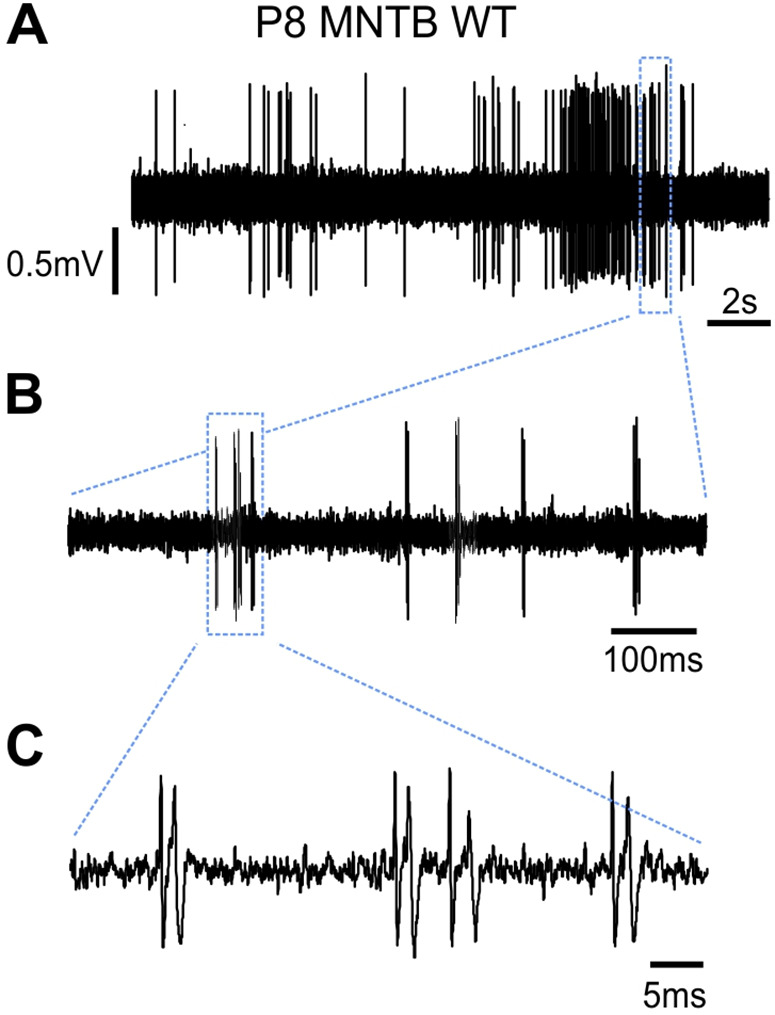
Figure 2—figure supplement 1. Spontaneous activity of an exemplary P8 medial nucleus of the trapezoid body (MNTB) wildtype neuron in vivo.


