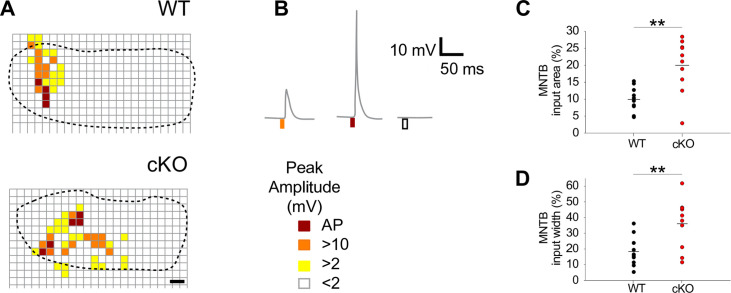
Figure 5. Medial nucleus of the trapezoid body-lateral superior olive (MNTB-LSO) input maps are enlarged upon disruption of TMEM16A.
(A) Exemplary MNTB input maps from wildtype (P9) and cKO mice (P10) as revealed by whole-cell current-clamp recordings (dotted line outlines the MNTB area, grid points indicate glutamate uncaging sites). The location of responsive (colored squares) and unresponsive (open squares) uncaging sites is indicated. Scale bar 40 µm. (B) Uncaging of glutamate close to presynaptic MNTB neurons gives rise to synaptic responses of various peak amplitudes (left), elicits action potentials (middle), or fails to evoke significant voltage signals (right) in the recorded LSO neurons (see color code below). (C, D) Quantification of MNTB input areas (summed area of all responsive uncaging sites) on a recorded LSO neuron and of the MNTB input widths (maximal distance of stimulations sites that evoked depolarization greater than 10 mV along the mediolateral [tonotopic] axis of the MNTB). MNTB input areas were normalized to the corresponding MNTB cross-sectional area and MNTB input widths to the length of the mediolateral axis of the MNTB. Values represent mean ± SEM (n = 10 WT; n = 10 cKO [P9–11]; two-way unpaired Student’s t-test: MNTB input area: p=0.0017, MNTB input width: p=0.0073).


