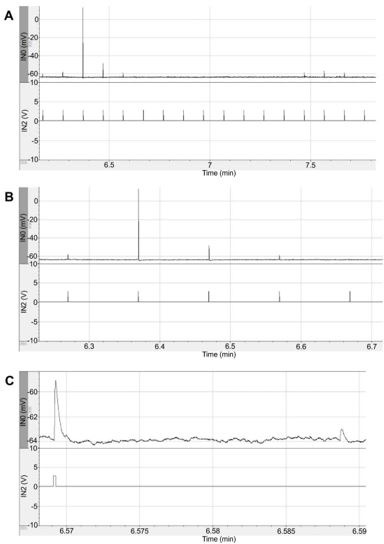
Author response image 1. (A-C) Example traces from the WT LSO cell for which the MNTB input map is shown in Figure S6D on the right.

The upper part of each trace shows the response of the LSO cell to glutamate uncaging in the MNTB. The timepoints of glutamate uncaging are shown in the lower part. (A) 1.5 min recording time. (B) 26 s recording time. (C) 1.3 s recording time. The trace clearly shows a depolarization of the LSO cell following glutamate uncaging in the MNTB (left) as well as a spontaneous signal (right).
