. 2022 Feb 24;11:e66080. doi: 10.7554/eLife.66080

Figure 3. Optical redox ratio and mean lifetime of nicotinamide adenine dinucleotide (phosphate) (NAD(P)H) are reduced in macrophages at the infected tail wound.

Tail fin transection distal to the notochord was performed using transgenic zebrafish larvae (Tg(mpeg1:mCherry-CAAX) that labels macrophages in the plasma membrane with mCherry) at 3 days post fertilization in the absence or presence of Listeria monocytogenes (Lm). Autofluorescence imaging of NAD(P)H and flavin adenine dinucleotide (FAD) was performed on live larvae at 48 hr post wound (Figure 1A). (A) Representative images of mCherry expression to show macrophages, optical redox ratio, and NAD(P)H and FAD mean lifetimes (τm) are shown for control or infected tail wounds; macrophages were outlined with dashed lines and the area was overlaid in the optical redox ratio and lifetime images to show corresponding area; in the infected condition only a few macrophages are outlined as examples; scale bar = 50 µm. Quantitative analysis of (B) optical redox ratio, (C) Optical Metabolic Imaging index, and (D) NAD(P)H mean lifetime (τm) from three biological repeats (control = 105 cells/16 larvae, infected = 761 cells/14 larvae) is shown; quantitative analysis of associated NAD(P)H and FAD mean (τm) and individual lifetime endpoints (τ1,τ2,α1), and sample size for each repeat are included in Figure 3—figure supplement 1. p values represent statistical analysis of the overall effects. Estimated means with 95% CI and overall effects with p values are included in Figure 3—source data 1.

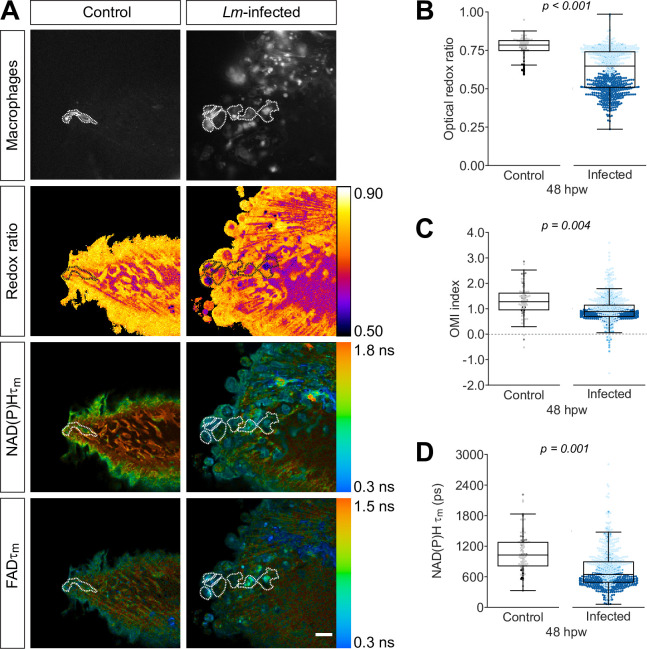
Figure 3—source data 1. Related to Figure 3.
elife-66080-fig3-data1.xlsx (150.6KB, xlsx)

Figure 3.

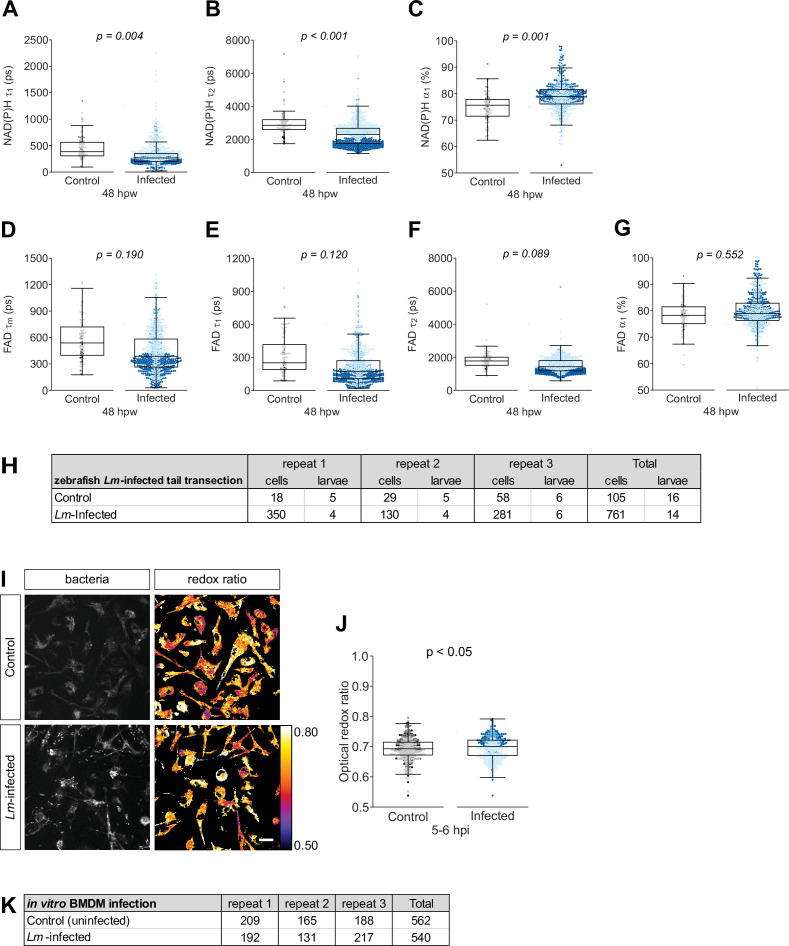
Figure 3—figure supplement 1. Individual nicotinamide adenine dinucleotide (phosphate) (NAD(P)H) and flavin adenine dinucleotide (FAD) fluorescence lifetime endpoints associated with Figure 3.

Figure 3—figure supplement 1.

Quantitative analysis of (A) tau1 (τ1), free/short lifetime of NAD(P)H, (B) tau2 (τ2), bound/long lifetime of NAD(P)H, (C) alpha1 (α1), fractional component of free NAD(P)H, (D) mean lifetime (τm) of FAD, (E) tau1 (τ1), bound/short lifetime of FAD, (F) tau2 (τ2), free/long lifetime of FAD, and (G) alpha1 (α1), fractional component of bound FAD. Log transformation was applied to τm, τ1 and τ2 prior to analysis. p values represent statistical analysis of the overall effects. Estimated means with 95% CI and overall effects with p values are included in Figure 3—source data 1. (H) Sample size of data set shown in Figure 3 and this supplement. (I) Mouse bone marrow-derived macrophages (BMDM) were infected with mCherry-labeled Listeria monocytogenes (Lm) at multiplicity of infection (MOI) of 2, and autofluorescence imaging of NAD(P)H and FAD was performed on live cells at 5–6 hr post infection. Representative images of mCherry (to show presence of bacteria) and optical redox ratio are shown for uninfected control or Lm-infected macrophages; scale bar = 50 µm. (J) Quantitative analysis of optical redox ratio. The diffuse cytoplasmic fluorescence in the mCherry images is likely due to FAD autofluorescence (Szulczewski et al., 2016). mCherry expressed by the bacteria was used to create a mask to exclude bacterial lifetime signals from macrophage data. Results from three independent repeats (K) are shown. Statistical comparison was performed by general linear model in R. This experiment was performed as an internal control to test that changes detected by fluorescence lifetime imaging microscopy (FLIM) are consistent with changes detected by a traditional method used to study metabolism, such as mass spec analysis. A previous study used 13C-isotopolog profiling to trace carbon metabolism during infection of primary mouse macrophages with Lm, and found that infection is associated with increased glycolytic activity in the host cells (Gillmaier et al., 2012). We detected a small but significant increase in the optical redox ratio of Lm-infected BMDMs, that is consistent with the findings of Gillmaier et al. The small magnitude in change may be due to several factors: while Gillmaier et al. tested specific pathways, FLIM measures global changes in intracellular metabolism that will reflect changes in multiple pathways and might dilute the overall effect; we used a lower MOI for infection and assayed intracellular metabolism at an earlier timepoint. Nevertheless, our overall conclusions are consistent with the findings of Gillmaier et al.