. 2021 Dec 29;10:e68679. doi: 10.7554/eLife.68679

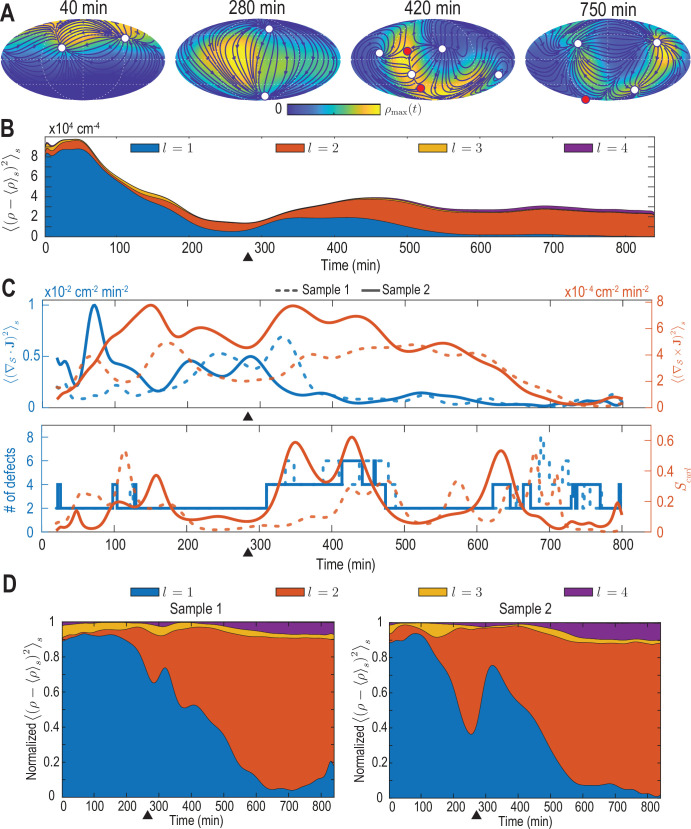
Figure 2. Mode signatures of developmental symmetry breaking and topological defects in cellular flux.

(A) Two-dimensional Mollweide projection of the compressed coarse-grained density field ρ(r,t) (colormap) and of the coarse-grained cell flux J(r,t) (streamlines) at different time points of zebrafish gastrulation.White circles depict topological defects of charge +1 in the flux vector field, red circles depict defects with charge -1. The total defect charge is 2 at all times. Defects are seen to ‘lead’ the large-scale motion of cells and later localize mostly along the curve defined by the forming spine. Animal pole (AP) and ventral pole (VP) are located at top and bottom, respectively. (B) Density fluctuations as a function of developmental time (see Equation 9), broken down in contributions from different harmonic modes l. The underlying symmetry breaking is highlighted prominently by this representation: During the first 75% of epiboly (0–280  min) cells migrate away from, but are still mostly located near the animal pole, presenting a density pattern with polar symmetry (l=1). During the following convergent extension phase cells converge towards a confined elongated region that is ‘wrapped’ around the yolk, corresponding to a density pattern with nematic symmetry (l=2). Black triangles indicate transition from epiboly to convergent extension. (C) Comparison of surface averaged divergence SJ and curl S×J of the cellular flux computed via Equation 10a and Equation 10b, respectively (top). A relative curl amplitude Scurl computed from these quantities via Equation 11 correlates with the appearance of an increased number of topological defects in the cell flux (bottom), suggesting that incompressible, rotational cell flux is associated with the formation of defects.

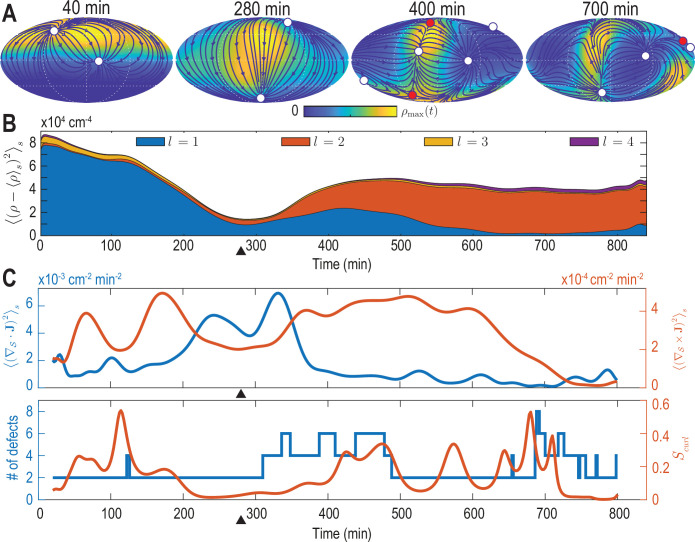
Figure 2.

Figure 2—figure supplement 1. Analysis of the harmonic mode representation for a second experimental dataset.

Figure 2—figure supplement 1.

(A–C) Analysis presented in Figure 2A–C of the main text performed on a second cell-tracking dataset (‘Sample 2’). In C, solid lines indicate results for Sample 2, dashed lines correspond to the results for the dataset discussed in the main text (‘Sample 1’). (D) Contributions to density fluctuations from both samples, broken down into contributions from different modes with harmonic mode number l and normalized at each time point by the total fluctuation intensity. Black triangles indicate the completion of epiboly.
Figure 2—figure supplement 2. Validation of automated defect tracking.

Figure 2—figure supplement 2.

Demonstration of the defect tracking on two example tangential vector fields on a spherical surface. (A) Vector field defined by J=Φ(2,2). (B) Vector field defined by J=Ψ(2,-1)+0.1Φ(2,2). Black lines depict the streamlines defined by these vector fields. White circles depict topological defects of charge +1, red circles depict defects with charge -1. For further details of the tracking approach see Materials and Methods.
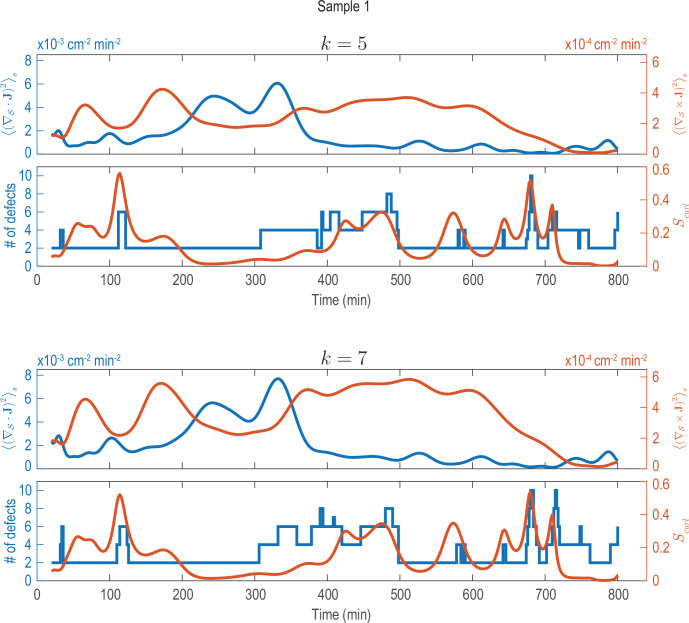
Figure 2—figure supplement 3. Analysis of fluxes and defects for different coarse-graining length scales (Sample 1).

Figure 2—figure supplement 3.

Analysis shown in Figure 2C performed on data that was coarse-grained with different coarse-graining length scales, represented by the parameter k (see Appendix 1—figure 2). Choosing larger (k=5) or smaller (k=7) coarse-graining length scales than used in Figure 2C (k=6), key signatures extracted from the data (dominant phases of divergent and rotary flows and a correlation between increased defect dynamics and cellular fluxes with curl) can still be robustly recovered.
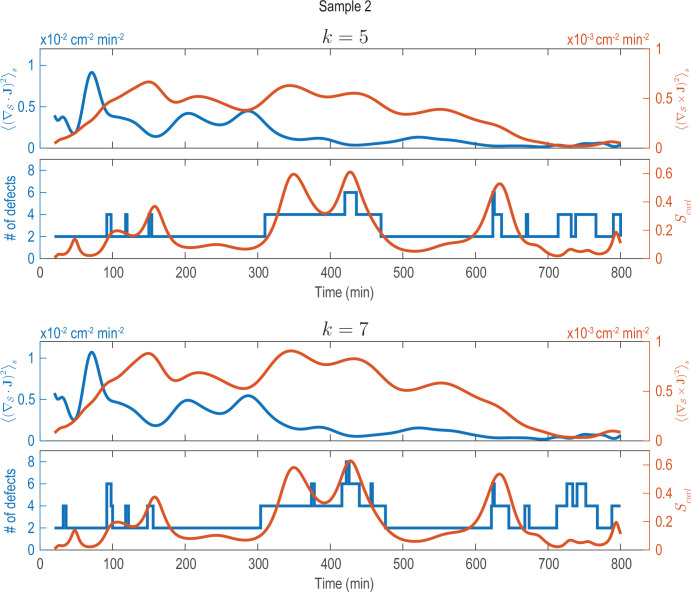
Figure 2—figure supplement 4. Analysis of fluxes and defects for different coarse-graining length scales (Sample 2).

Figure 2—figure supplement 4.

Analysis shown in Figure 2—figure supplement 1C (solid lines) performed on data that was coarse-grained with different coarse-graining length scales, represented by the parameter k (see Appendix 1—figure 2). Choosing larger (k=5) or smaller (k=7) coarse-graining length scales than used in Figure 2—figure supplement 1C (k=6), key signatures extracted from the data (dominant phases of divergent and rotary flows and a correlation between increased defect dynamics and cellular fluxes with curl) can still be robustly recovered.