. 2022 Feb 24;11:e70726. doi: 10.7554/eLife.70726

Figure 1. Protein aggregation is increased following a functional loss of ataxia telangiectasia mutated (ATM), ataxia telangiectasia and Rad3-related (ATR), and upon topoisomerase poisoning.

See also Figure 1—figure supplement 1. (A) In-gel Coomassie staining of indicated fractions of cell extracts of WT and ATM KO U2OS cells. The relative amounts of each fraction loaded are indicated. (B) Quantification of (A). Circles depict individual experiments; gray dotted lines depict matched pairs. Wilcoxon matched-pairs signed-rank test. (C) Aggregated (silver stain) and whole-cell lysate (WCL; Coomassie) fractions of HEK293T cells treated transiently with chemical agents targeting the indicating proteins (see Table 1 for drugs and doses used; for etoposide [Etop]: 3 μM; for camptothecin [CPT]: 100 nM). See also Figure 1—figure supplement 1D. (D) Quantification of (C). Circles depict individual experiments. Two-tailed Student’s t-test with Bonferroni correction. (E) Protein fractions of HEK293T cells treated transiently with increasing amounts of CPT (20–100 nM) or Etop (0.6–3 μM). (F) Quantification of (E). Two-tailed Student’s t-test with Bonferroni correction. (G) Protein fractions of HEK293T cells treated transiently with CPT (40 nM) or Etop (1.5 μM), targeting TOP1 or TOP2, respectively, 24 hr or 72 hr after treatment. (H) Quantification of (G). Two-tailed Student’s t-test with Bonferroni correction. In (B), (D), (F), and (H), the red line indicates the mean.

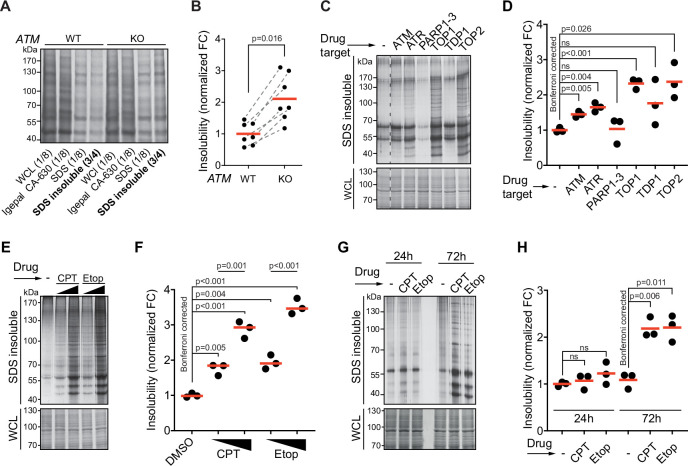
Figure 1—source data 1. Data from Figure 1A.
Raw Coomassie-stained SDS-PAGE gel with cropped parts indicated in red.
Figure 1—source data 2. Data from Figure 1C.
Raw Coomassie- and silver-stained SDS-PAGE gels with cropped parts indicated in red.
Figure 1—source data 3. Data from Figure 1E.
Raw Coomassie- and silver-stained SDS-PAGE gels with cropped parts indicated in red.
Figure 1—source data 4. Data from Figure 1G.
Raw Coomassie- and silver-stained SDS-PAGE gels with cropped parts indicated in red.

Figure 1.

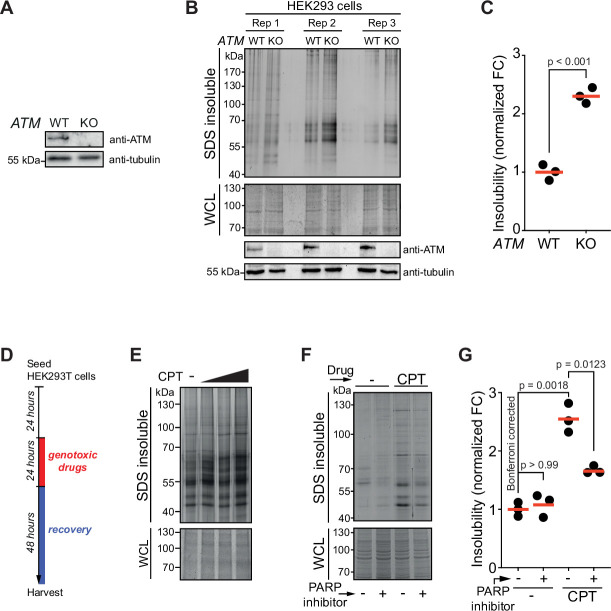
Figure 1—figure supplement 1. Aggregation is increased in cells lacking ataxia telangiectasia mutated (ATM).

Figure 1—figure supplement 1.

Western blot of U2OS wild-type and ATM KO cells, probed using the indicated antibodies. (B) Aggregated (silver stain) and whole-cell lysate (WCL; Coomassie) fractions of HEK293 wild-type and ATM KO cells. Three independent biological repeats were loaded on one gel and stained in-gel. WCL fractions were also subjected to Western blotting and probed using the indicated antibodies. (C) Quantification of (A). Circles depict individual experiments. Two-tailed Student’s t-test. (D) Experimental outline of Figure 1C and E. (E) Aggregated (silver stain) and WCL (Coomassie) fractions of U2OS cells treated with increasing doses of camptothecin (CPT) (0.2, 0.4, 0.6 μM). n = 2. (F) Aggregated (silver stain) and WCL (Coomassie) fractions of HEK293T cells treated transiently with CPT (40 nM) following the same experimental set-up as in (D). PARP inhibitor (4 μM, see also Materials and methods) was added during the recovery period. (G) Quantification of (F). Circles depict individual experiments. Two-tailed Student’s t-test with Bonferroni correction. In (C) and (G), red lines indicate the mean.
Figure 1—figure supplement 1—source data 1. Data from Figure 1—figure supplement 1A.
Raw Western blot images with antibodies annotated and cropped parts indicated in red.
Figure 1—figure supplement 1—source data 2. Data from Figure 1—figure supplement 1B.
Raw Coomassie- and silver-stained SDS-PAGE gels and Western blot images with antibodies annotated and cropped parts indicated in red.
Figure 1—figure supplement 1—source data 3. Data from Figure 1—figure supplement 1E.
Raw Coomassie- and silver-stained SDS-PAGE gels with cropped parts indicated in red.
Figure 1—figure supplement 1—source data 4. Data from Figure 1—figure supplement 1F.
Raw Coomassie- and silver-stained SDS-PAGE gels with cropped parts indicated in red.