. 2022 Feb 24;11:e70726. doi: 10.7554/eLife.70726

Figure 2. Camptothecin (CPT) and ataxia telangiectasia mutated (ATM) loss drives aggregation in a cell-type-dependent manner.

See also Figure 2—figure supplement 1. (A) Volcano plot of label-free quantification (LFQ) MS/MS analysis of the aggregated fractions of DMSO and CPT-treated HEK293T cells. n = 4. Only proteins identified in >1 repeats of either case or control are shown. (B) Volcano plot of LFQ MS/MS analysis of the aggregated fractions of DMSO and ATM inhibitor-treated HEK293T cells. n = 4. Only proteins identified in >1 repeats of either case or control are shown. (C) Venn diagram showing overlap between U2OS and HEK293T increased aggregation, after the indicated treatments. (D) Western blot using the indicated antibodies on the aggregated and whole-cell lysate (WCL) fractions of drug-treated and ATM KO HEK293 cells, and wild-type U2OS cells. n = 2. (E) GO term analysis (Function) of the increased aggregation in CPT- or ATM-inhibitor-treated HEK293T cells. (F) Venn diagram showing overlap between increased aggregation after the indicated treatments in HEK293T cells and baseline aggregation in U2OS cells. (G) Aggregated (silver stain) and WCL (Coomassie) fractions of untreated HEK293T and U2OS cells. n = 2.

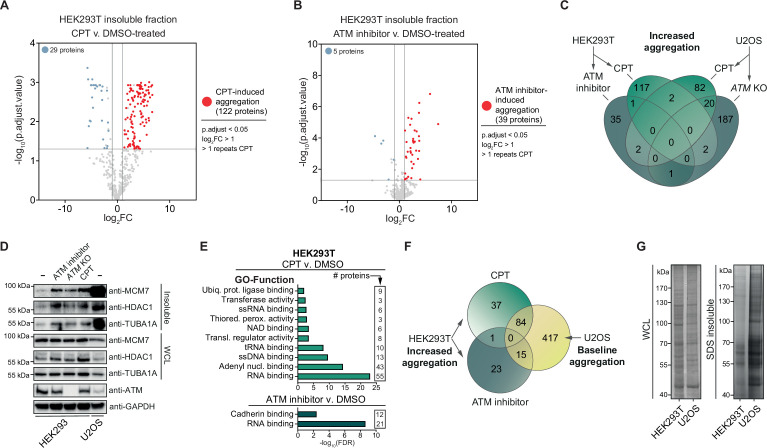
Figure 2—source data 1. Data from Figure 2D.
Raw Western blot images with each antibody annotated and cropped parts indicated in red.
Figure 2—source data 2. Data from Figure 2G.
Raw Coomassie- and silver-stained SDS-PAGE gels with cropped parts indicated in red.

Figure 2.

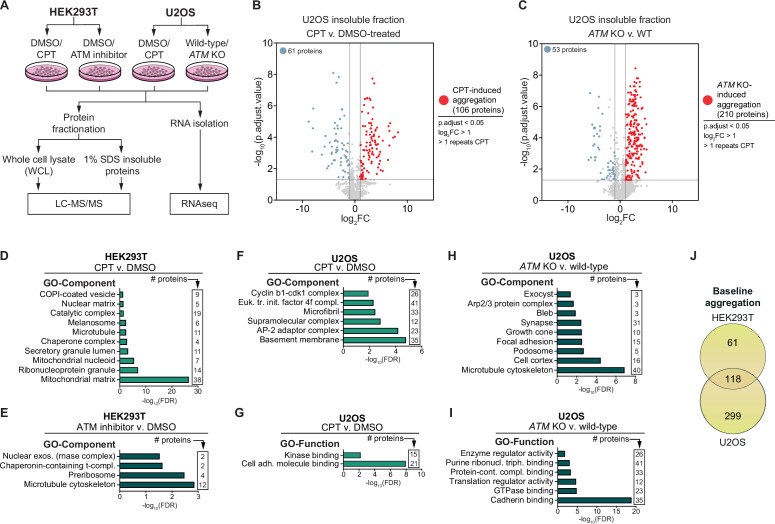
Figure 2—figure supplement 1. GO term analyses of the aggregation triggered by camptothecin (CPT) and ataxia telangiectasia mutated (ATM) loss.

Figure 2—figure supplement 1.

(A) Experimental outline. All samples (whole-cell lysate [WCL], 1% SDS insoluble proteins, and RNA) were generated in parallel from the same cells in four independent repeats for each experiment. (B) Volcano plot of label-free quantification (LFQ) MS/MS analysis of U2OS wild-type and ATM KO cells. n = 4. Only proteins identified in >1 repeats of either case or control are shown. (C) Volcano plot of LFQ MS/MS analysis of U2OS cells DMSO or CPT treated. n = 4. Only proteins identified in >1 repeats of either case or control are shown. (D–I) GO term analysis (Component and Function) of the increased aggregation after the indicated treatment in the indicated cell line. GO terms with <2000 background genes (max 10 terms) are shown. (J) Venn diagram showing overlap between U2OS and HEK293T baseline aggregation.