(
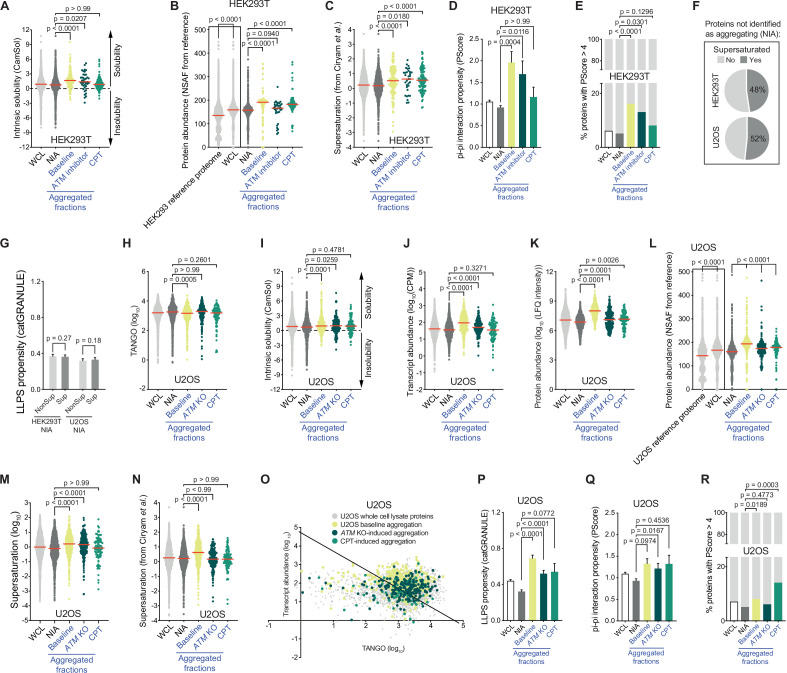
A) CamSol-intrinsic (in)solubility scores of complete whole-cell lysate (WCL), nonaggregated proteins (NIA), and aggregated fractions in HEK293T cells. Dotted line indicates the theoretical threshold of relative intrinsic (in)solubility. See text for reference. (
B) Protein abundances of HEK293T WCL and aggregated fractions obtained by cross-referencing with a HEK293 NSAF (normalized spectral abundance factor) reference proteome, as well as the protein abundances of the entire HEK293 reference proteome itself (see text for reference). (
C) Supersaturation scores obtained by cross-referencing with the human composite supersaturation database generated by Ciryam et al. (see text for reference) for HEK293T cells. (
D) PScores of complete WCL, nonaggregated proteins (NIA), and aggregated fractions in HEK293T. (
E) Presence of proteins with a high PScore (> 4) in the indicated fractions in HEK293T. See also text. (
F) Distribution of supersaturated (Sup) and non-supersaturated (NonSup) proteins in the HEK293T and U2OS NIA fractions. (
G). catGRANULE scores of supersaturated (Sup) and non-supersaturated (NonSup) proteins in HEK293T and U2OS NIA fractions. (
H) TANGO scores of complete WCL, nonaggregated proteins (NIA), and aggregated fractions in U2OS cells. (
I) CamSol-intrinsic (in)solubility scores of complete WCL, nonaggregated proteins (NIA), and aggregated fractions in U2OS cells. Dotted line indicates the theoretical threshold of relative intrinsic (in)solubility. (
J) Transcript abundances (as measured by RNAseq) of the indicated fractions in U2OS cells. (
K) Protein abundance as measured by label-free quantification (LFQ) intensities of the indicated fractions in U2OS cells. (
L) Protein abundances of U2OS WCL and aggregated fractions obtained by cross-referencing with a U2OS normalized spectral abundance factor (NSAF) reference proteome, as well as the protein abundances of the entire U2OS reference proteome itself (see text for reference). (
M) Supersaturation scores for the indicated protein fractions in U2OS cells. (
N) Supersaturation scores obtained by cross-referencing with the supersaturation database generated by Ciryam et al. (see text for reference) for U2OS cells. (
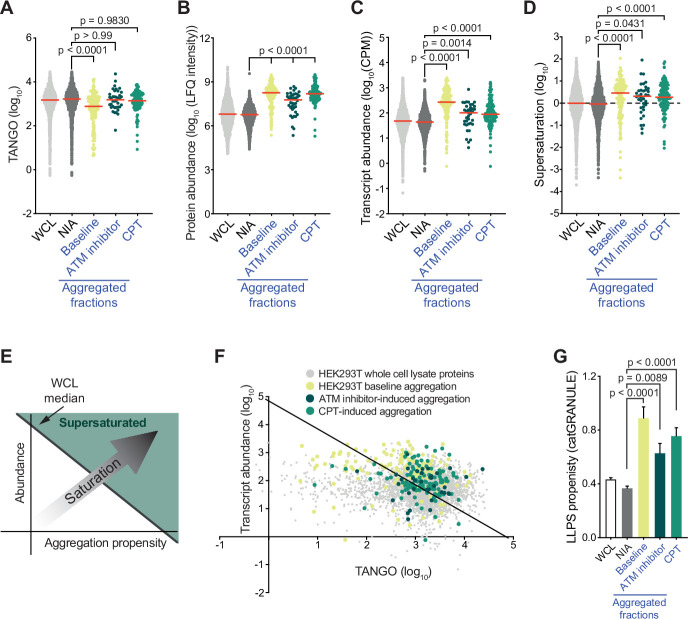
O) Transcript abundances (as measured by RNAseq) plotted against TANGO scores for the complete U2OS MS analysis. All proteins above the diagonal (=U2 OS median saturation score, calculated using the U2OS WCL dataset) are relatively supersaturated. See also
Figure 3E and F. (
P) catGRANULE scores for the indicated protein fractions in U2OS cells. (
Q) PScores of complete WCL, nonaggregated proteins (NIA), and aggregated fractions in U2OS. (
R) Presence of proteins with a high PScore (>4) in the indicated fractions in U2OS. For all bar graphs, bars represent mean ± SEM. For all other graphs, circles represent individual proteins, red lines indicate the median value. p-Values are obtained by Kruskal–Wallis tests followed by Dunn’s correction for multiple comparisons, except in N, where two-tailed Mann–Whitney tests were used.


