
Figure 5. The lowered aggregation threshold caused by topoisomerase poisoning or a loss of ataxia telangiectasia mutated (ATM) is accompanied by a rewiring and aggregation of known interacting (co)chaperones.
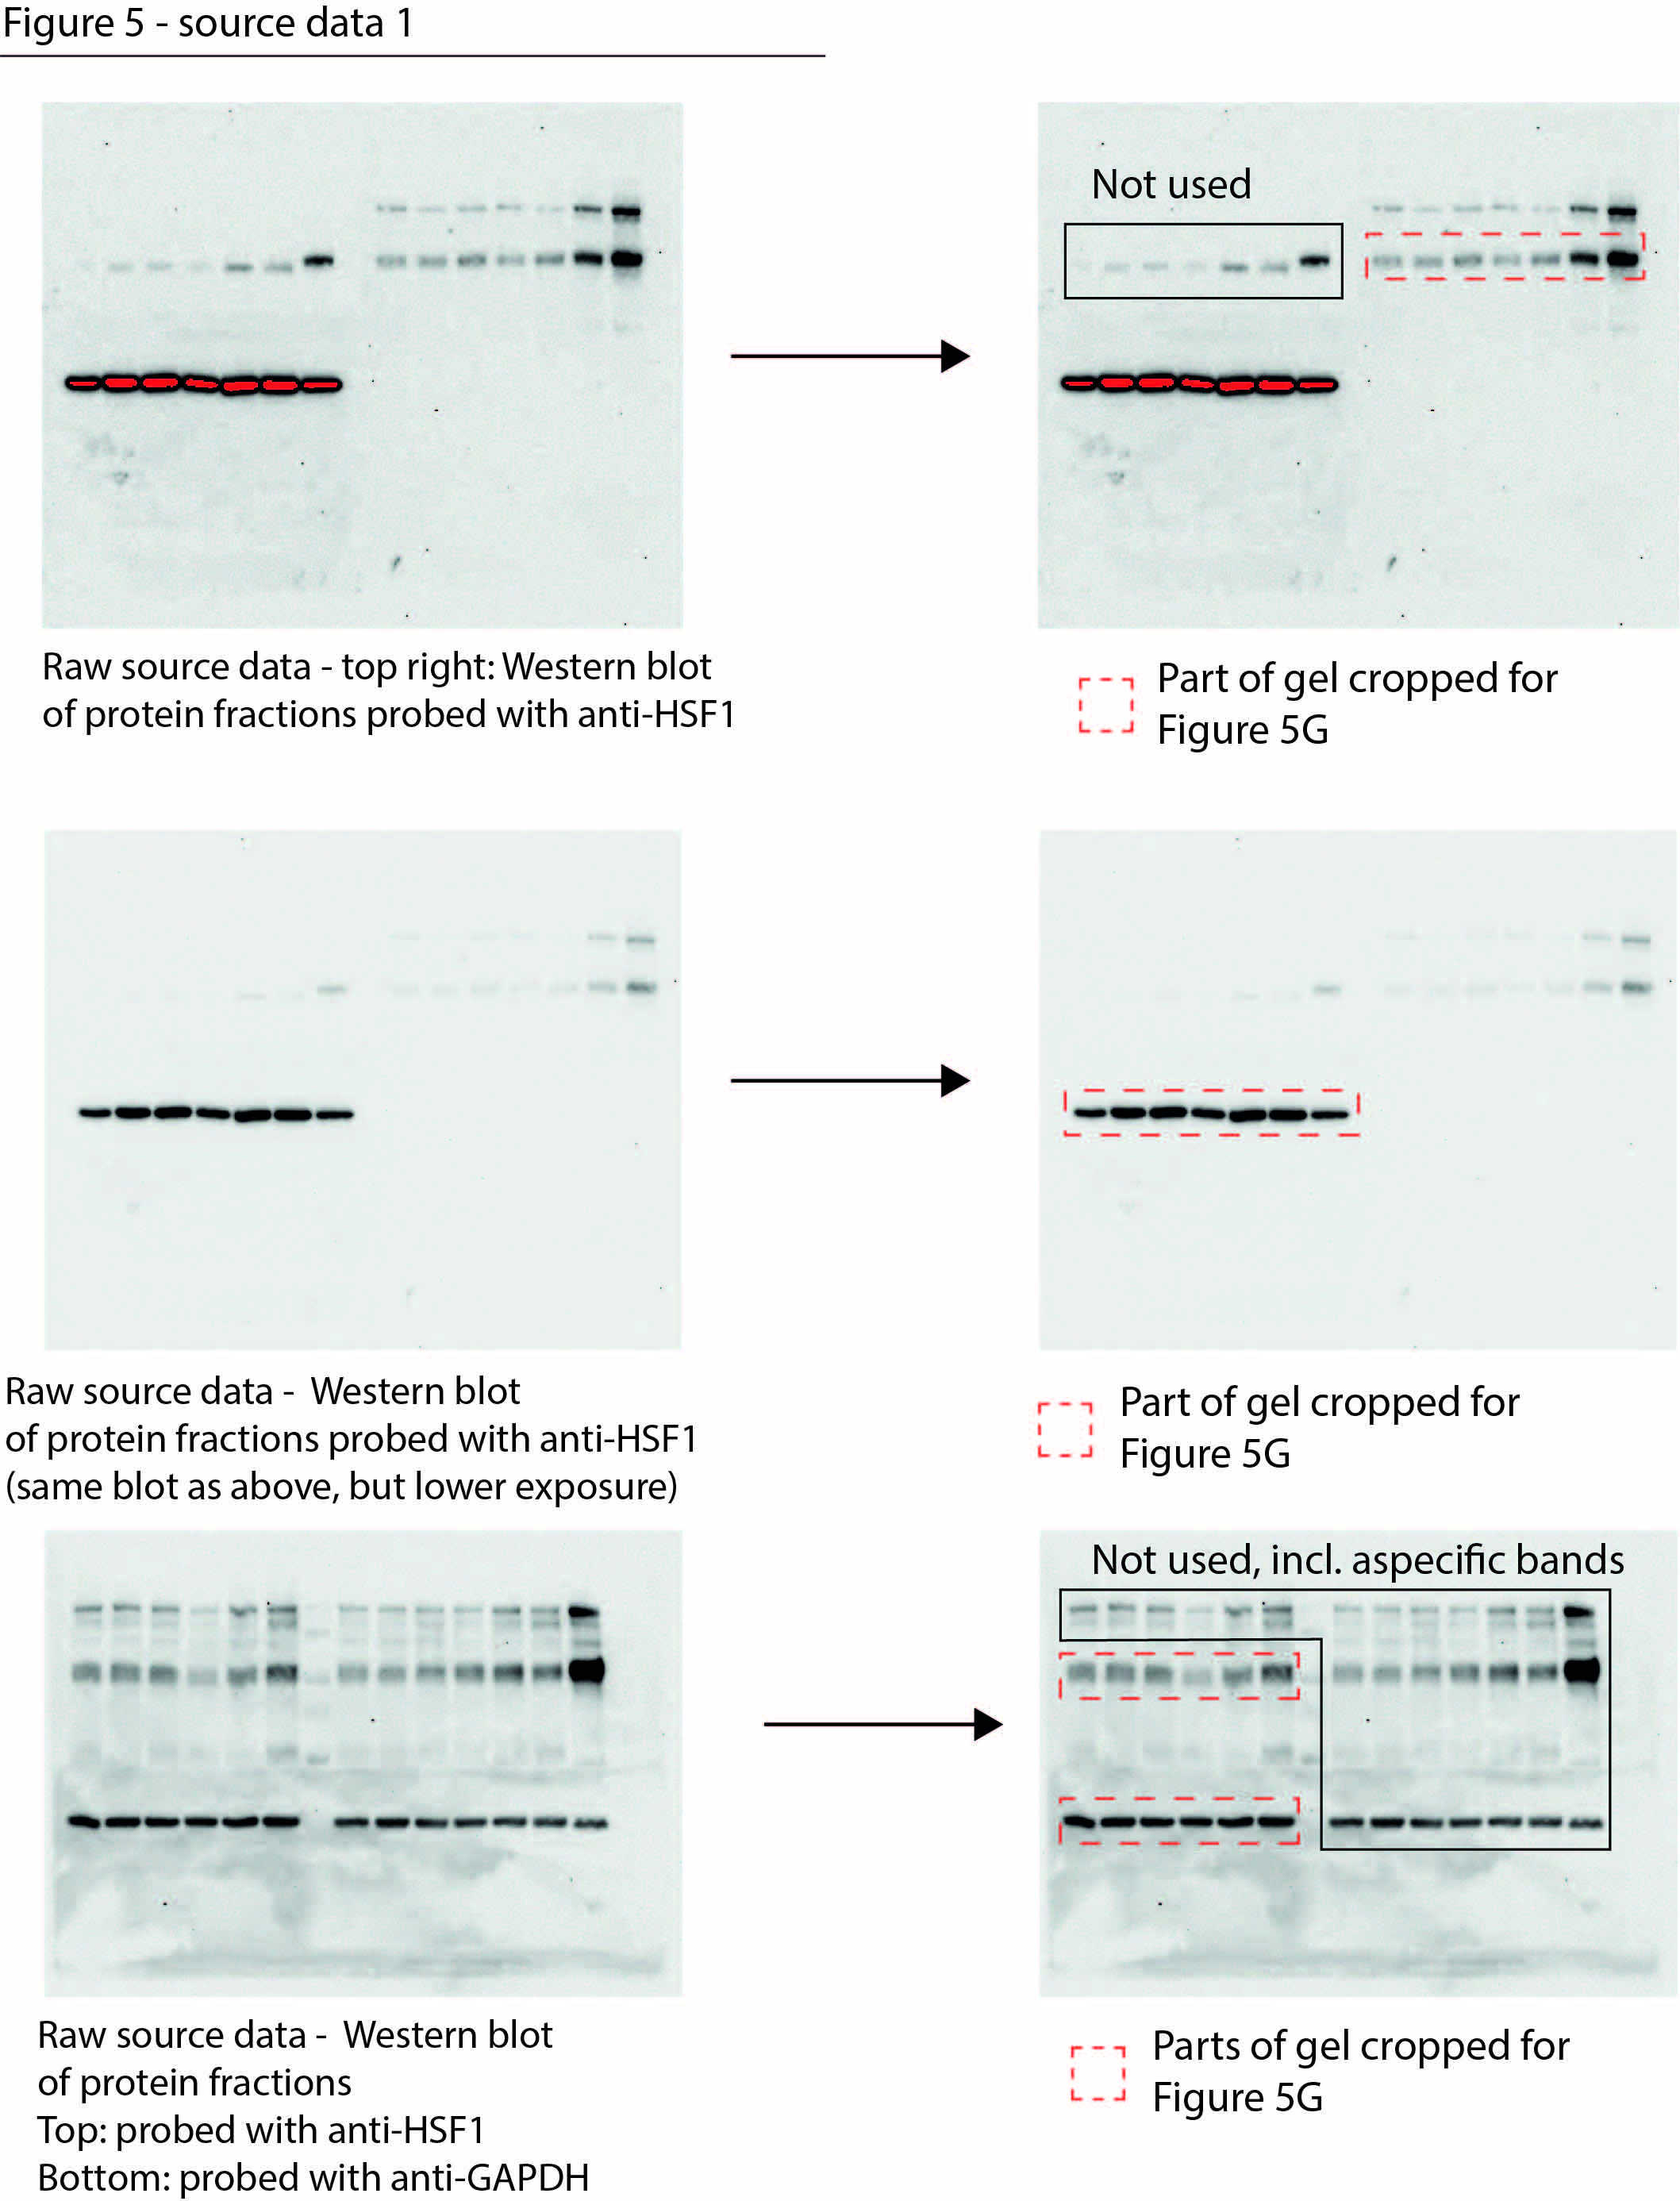
See also Figure 5—figure supplements 1 and 2. (A) Presence of (co)chaperones in the aggregated protein fractions in HEK293T cells. Left panel: Venn diagram showing the overlap in aggregating chaperones. Right panel: graph depicting the overlap in aggregating chaperones in detail. (B) Pie charts showing the presence of HSPA1A and HSPA8 clients in aggregated protein fractions compared to clients present in both NIA fractions. See text for reference; only clients identified in at least two out of three repeats in Lee et al. were taken into account here. (C) Table showing the number of (co)chaperones logged in BioGRID as interacting with NIA and aggregating protein fractions. (D) See also (A): only (co)chaperones aggregating in both HEK293T experimental set-ups or significantly more in one of them are shown here. BioGRID (co)chaperone interactions with the aggregated proteins identified in this study, per (co)chaperone. Darker colors represent a higher percentage of proteins with a reported binding to that (co)chaperone. See Figure 5—figure supplement 2 for a complete overview. (E) Volcano plot showing protein levels of (co)chaperones in camptothecin (CPT)-treated HEK293T cells compared to DMSO-treated cells. (F) Differentially expressed (co)chaperones in CPT-treated HEK293T cells compared to DMSO-treated cells based on RNAseq data. (G) Western blot analysis using the indicated antibodies on the whole-cell lysate (WCL) fractions of HEK293T cells after the indicated time and treatment. HS, heat shock (2 hr at 43°C incubator). n = 2. (H) Graph showing (co)chaperones whose genes show a differential expression in both CPT-treated HEK293T cells compared to DMSO-treated HEK293T cells and in untreated U2OS compared to untreated HEK293T cells.

Figure 5—figure supplement 1. Chaperone systems are rewired in line with the presence of chaperone clients in aggregates induced by camptothecin or ataxia telangiectasia mutated (ATM) loss.

Figure 5—figure supplement 2. Heatmaps of chaperone interactions of aggregating fractions.
