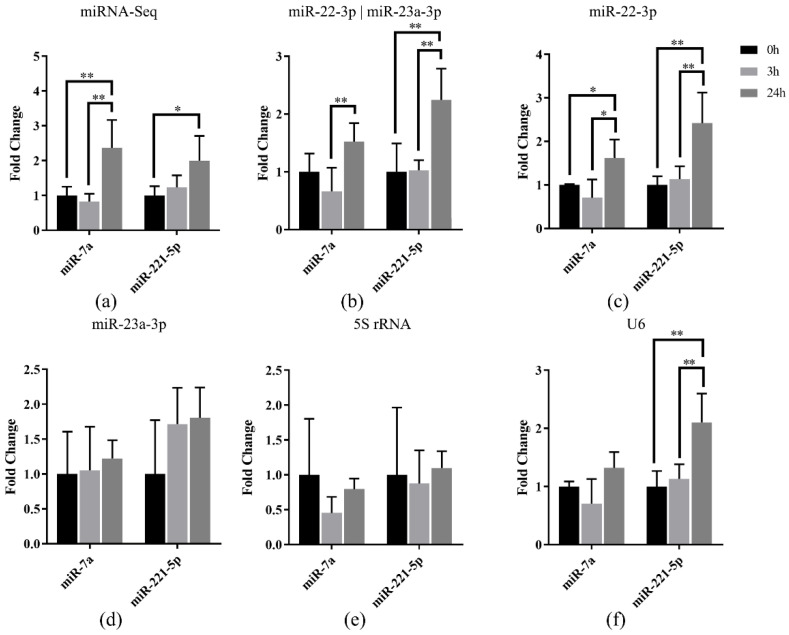
Figure 5.
Relative quantification of miR-7a and miR-221-5p expression in livers of Japanese flounder infected with E. tarda at different time points by (a) miRNA-Seq and qRT-PCR referenced with (b) miR-22-3p and miR-23a-3p, (c) miR-22-3p, (d) miR-23a-3p, (e) 5S rRNA, and (f) U6, respectively. Data are shown as mean ± SD (n = 3). Asterisks indicate statistical significance between groups (* p < 0.1 and ** p < 0.05).

