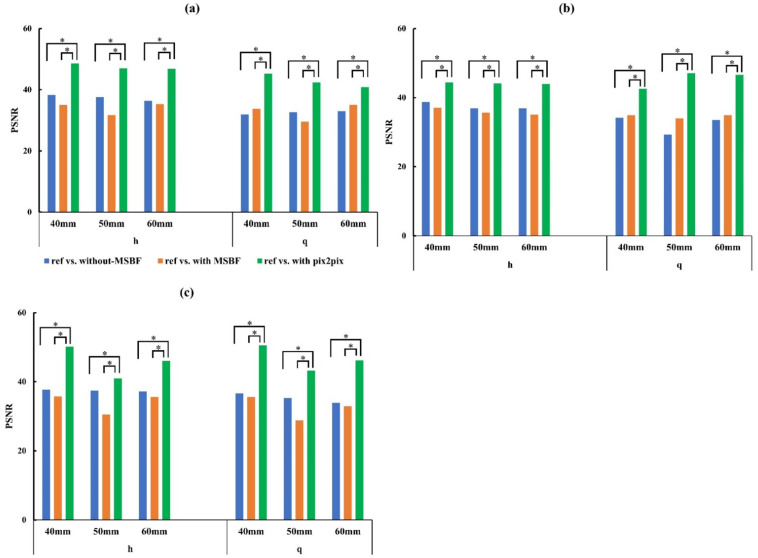
Figure 9.
Plots of the peak signal-to-noise ratio (PSNR) vs. reference vs. without pre-reconstruction processing, reference vs. with multiscale bilateral filtering (MSBF) pre-reconstruction processing, reference vs. pix2pix pre-reconstruction processing from the in-focus plane for low dose with variant phantom thickness. (a) In-focus plane for evaluation of 0.19- and 0.23-mm microcalcifications (MCs). (b) In-focus plane for evaluation of 0.29-mm MCs and 3.9-mm masses. (c) In-focus plane for evaluation of 4.7-mm mass. h: approximately 50% reduction of automatic exposure control reference dose (AECrd); q: approximately 75% reduction of AECrd. (Tukey–Kramer test; p < 0.05 indicates a significant difference, *: significant).

