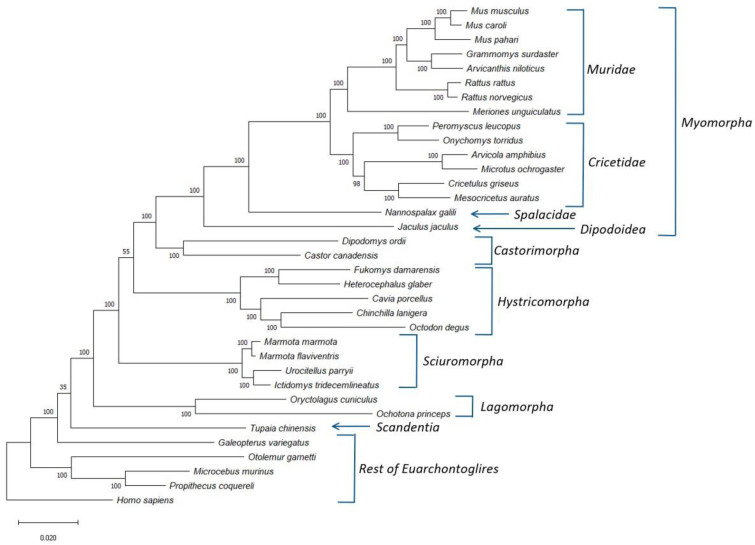
Figure 1.
A maximum likelihood distance tree for the Glires species based on concatenated sequences for 25 conserved proteins. The bootstrap score for each branch point is shown at the nodes and numbers on the bar at the bottom indicates the number of changes per position. Major clades within the Glires/Rodentia are labelled and the tree was rooted using the Homo sapiens sequence.

