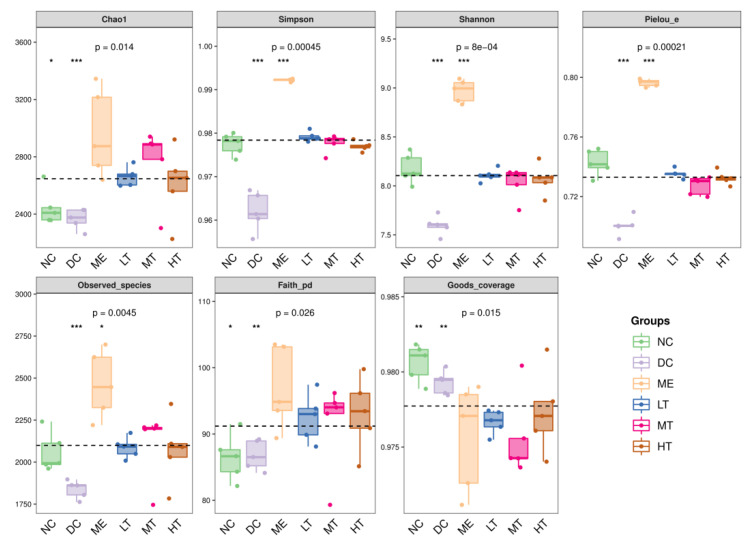
Figure A3.
Grouped box plot of Alpha Diversity Index.Note: Each panel corresponds to an alpha diversity index, which is identified in the gray area at the top of the panel. The numbers under the diversity index label are the p values of the Kruskal–Wallis test. * represents a significant difference between the subgroup below it and the whole formed by the samples of all the remaining subgroups (p < 0.05); ** represents a highly significant difference (p < 0.01); *** represents a highly significant difference (p < 0.001).

