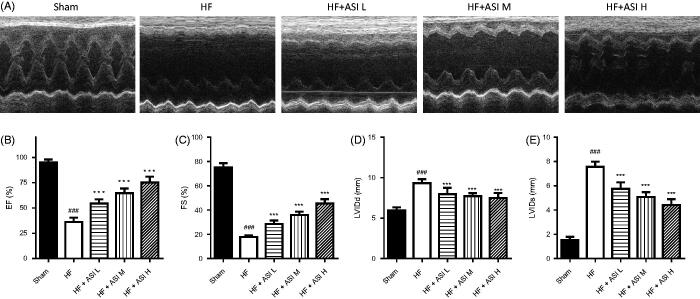
Figure 2.
Cardiac function of the rats. After the treatment for 6 weeks, cardiac function of the rats was dynamically evaluated by echocardiography. A. Representative echocardiographic records obtained from a short-axis mid-ventrical view of the hearts. B–E. Statistical analysis of the data obtained or derived from original echocardiographic records. Data are presented as Mean ± SD. N = 6. ###p < 0.001 vs. sham group. ***p < 0.001 vs. model group.

