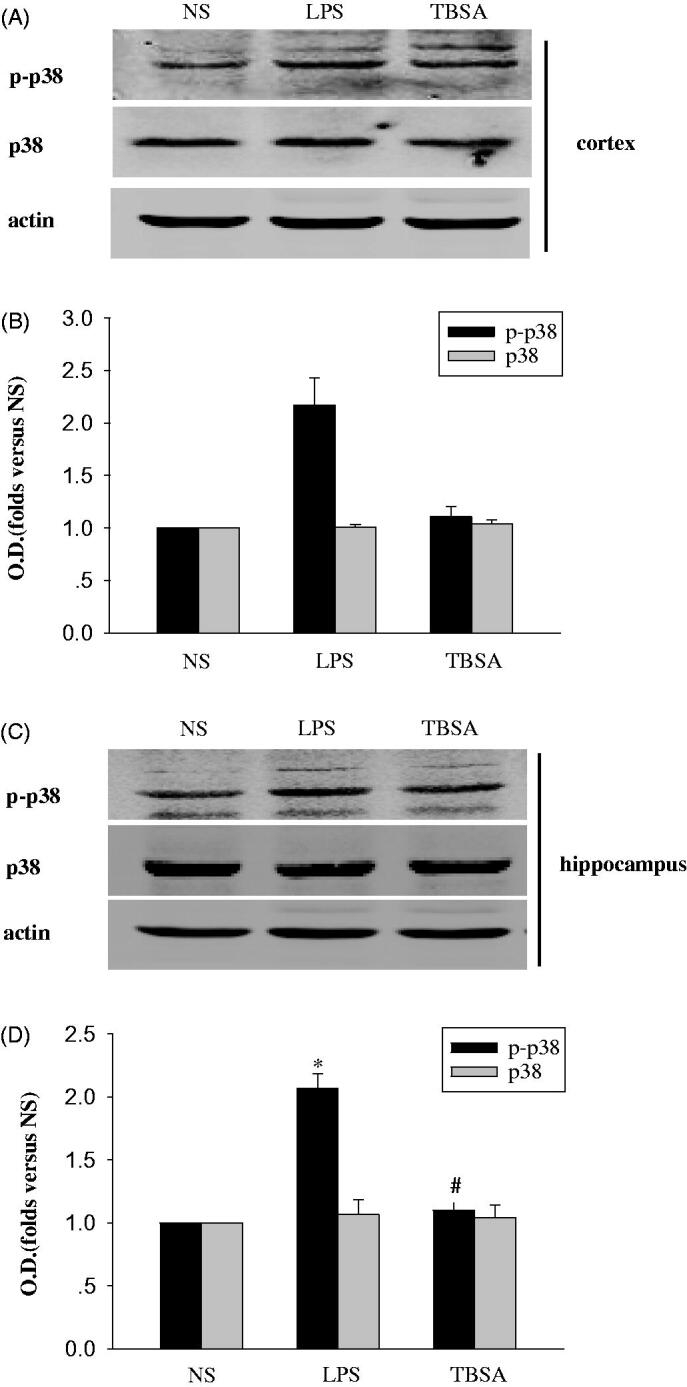
Figure 2.

HDAC6 inhibition suppresses p38MAPK expression in the mouse frontal cortex and hippocampus after LPS treatment. (A and C) Immunoblots of the phosphorylation of p38MAPK in the cortex and hippocampus. (B and D) The intensity of the bands was determined by analyzing the optical density (O.D.). Data are presented as means ± SEM and are expressed as fold changes compared with the saline group. *p < 0.05 compared with respective NS group; #p < 0.05 compared with respective LPS group (n = 6).
