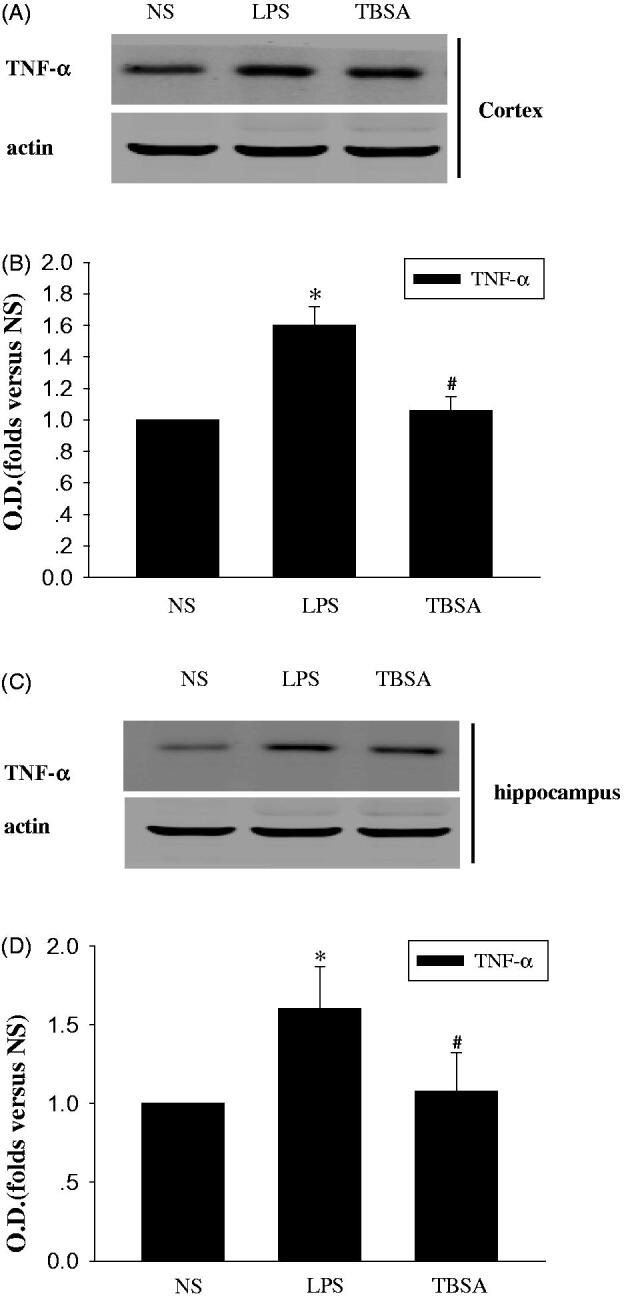
Figure 3.

HDAC6 inhibition restrains the expression of TNF-α in the frontal cortex and hippocampus after LPS treatment. (A and C) Immunoblots of the levels of the TNF-α protein in cortex and hippocampus. (B and D) The intensity of the bands was determined by analyzing the optical density (O.D.). Data are presented as means ± SEM and are expressed as fold changes compared with the saline group. *p < 0.05 compared with respective NS group; #P < 0.05 compared with respective LPS group (n = 6).
