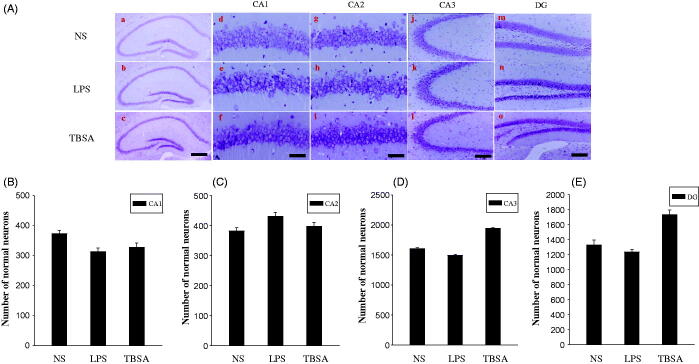
Figure 6.
Effect of HDAC6 inhibition on neurons in the hippocampus. (A) Typical images of cresyl violet-stained sections from the hippocampus of the NS group (a, d, g, i and m), mice injected with LPS for 12 days (b, e, h, k and n) and mice treated with both LPS and TBSA (c, f, i, l and o). Data were obtained from six independent animals in each experimental group and the results of a typical experiment are presented here. Boxed areas in the left column are shown at higher magnification in the right column. Scale bar in d = 200 μm; Scale bar in h = 20 μm. (B, C, D and E) The cell density was calculated in the hippocampal CA1, CA2, CA3 and DG regions. Data were obtained from six independent animals in each experiment group. *p < 0.05 compared with the respective saline group; #p < 0.05 compared with the respective LPS group.

