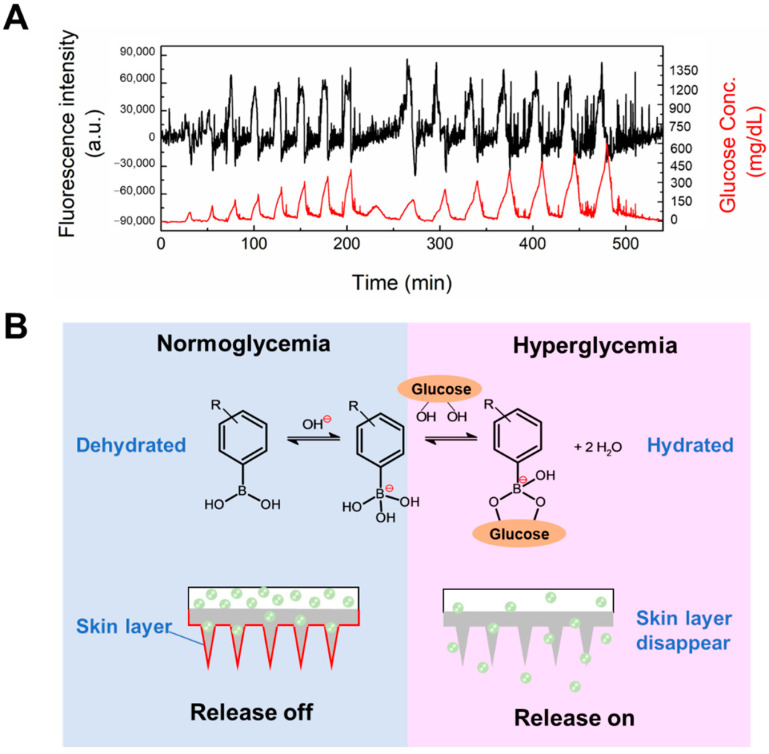
Figure 7.
(A) In vitro glucose-responsive insulin release experiment at pH 7.4 and 37 °C. Time-course changes in the fluorescence intensity of FITC-labeled insulin released from microneedle with a “cake-like” structure (black line). Temporal patterns of the fluctuation in glucose concentration (red line). Initial equilibration was performed until no leakage of insulin was found. (B) Glucose-dependent equilibria of PBA derivatives and schematic representation of skin-layer-regulated glucose-responsive insulin release.

