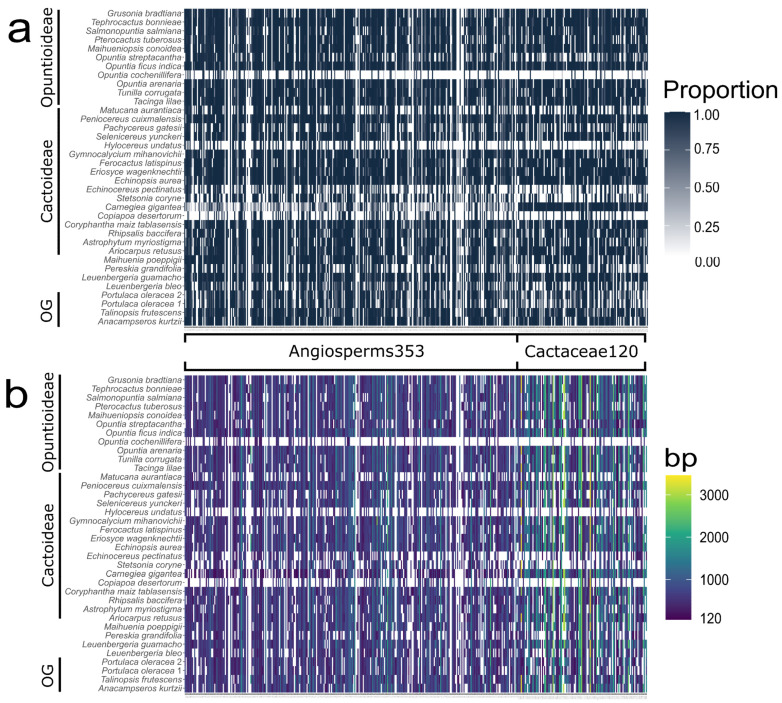
Figure 2.
Heatmap plot showing recovery efficiency. Columns represent the targeted loci grouped based on probe sets and rows represent the 36 transcriptomes grouped based on the main groups in Cactaceae (OG: outgroup). (a) Length proportion of the target sequences recovered. (b) Size of the target gene sequences recovered.

