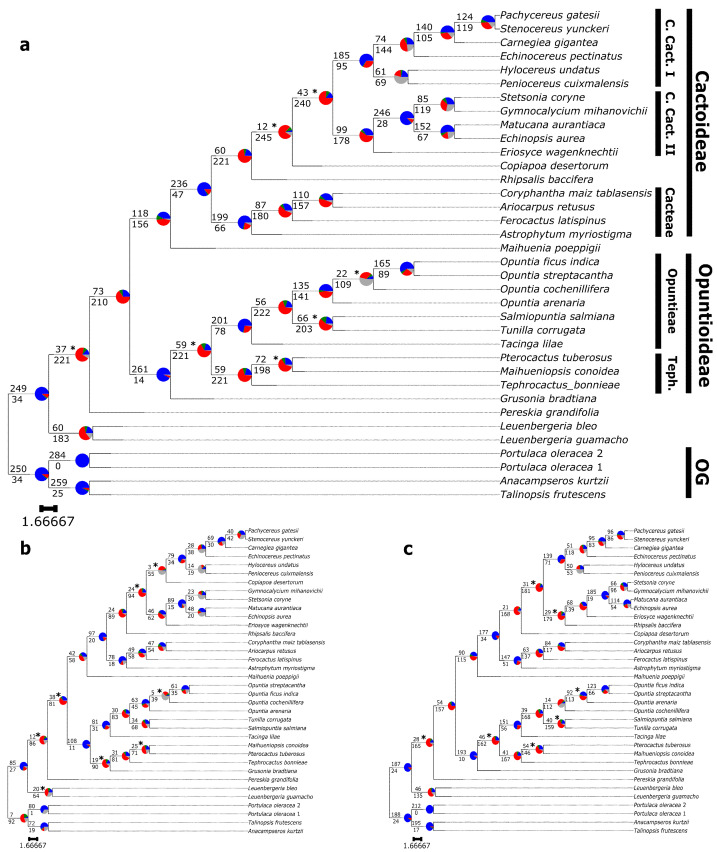
Figure 4.
ASTRAL species tree with pie charts on the nodes representing gene tree topology proportions: blue represents concordance with the shown topology, green is the top alternative bipartition; red is all the other alternative bipartitions; and grey is no support for conflicting bipartition. Branch values represent concordance (top) and conflicting (bottom) gene trees. Asterisks mark all nodes with a posterior probability of ≤90 and scale bars represent coalescent units. (a) C120 and A353 probe sets combined. OG: Outgroups; Teph.: Tephrocacteae; C. Cact.: Core Cactoideae. (b) C120 probe set. (c) A353 probe set.

