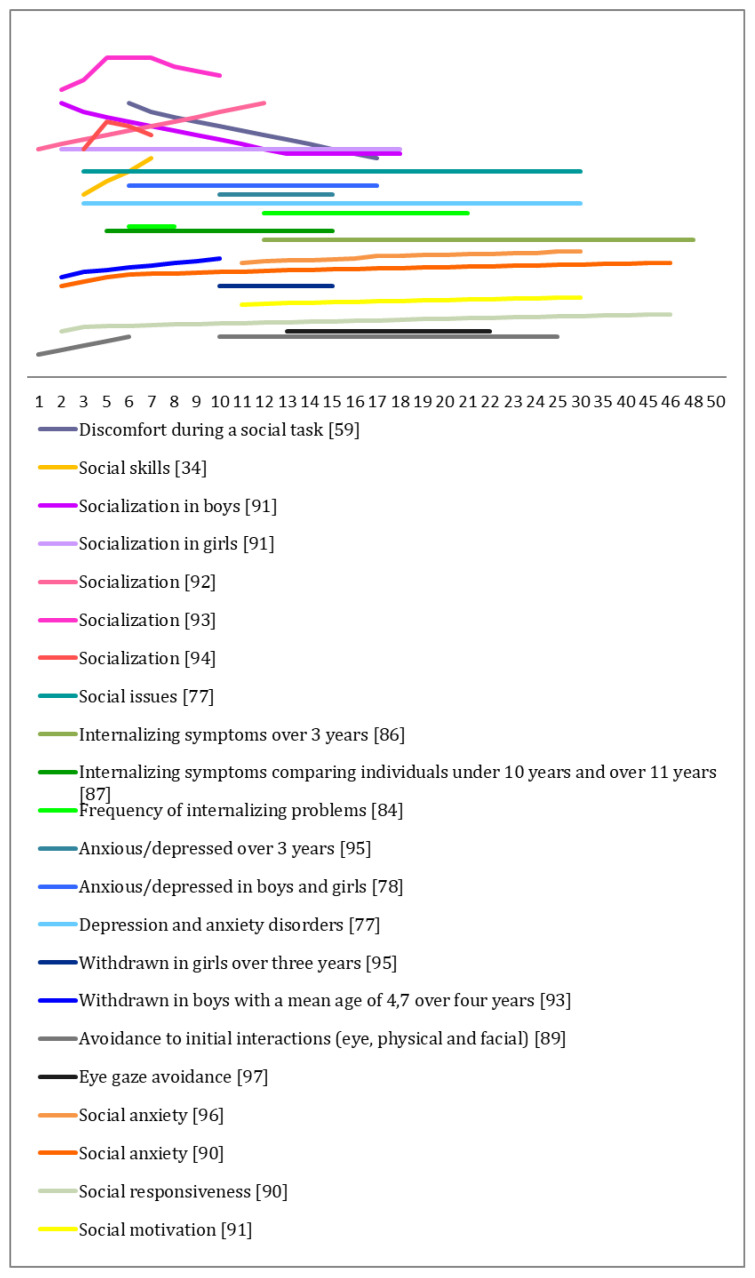
Figure A2.
Trajectories of social competence from the studies reviewed. This graph provides descriptive information of the trajectories reported in the studies reviewed [34,59,77,78,84,86,87,89,90,91,92,93,94,95,96,97]. The Y-axis has been removed because of the use of different measures and comparisons not being possible. Higher or lower lines do not represent greater problem behaviors or a higher frequency of behavior problems, nor does the slope. Each line should be compared with itself. For example, in this graph, social anxiety and social skills increase over the years, but scores for social skills are not higher than those of social anxiety, nor do social skills increase faster over the years. One finding from the graph is that social skills increased from 3 to 6 years in [34].

