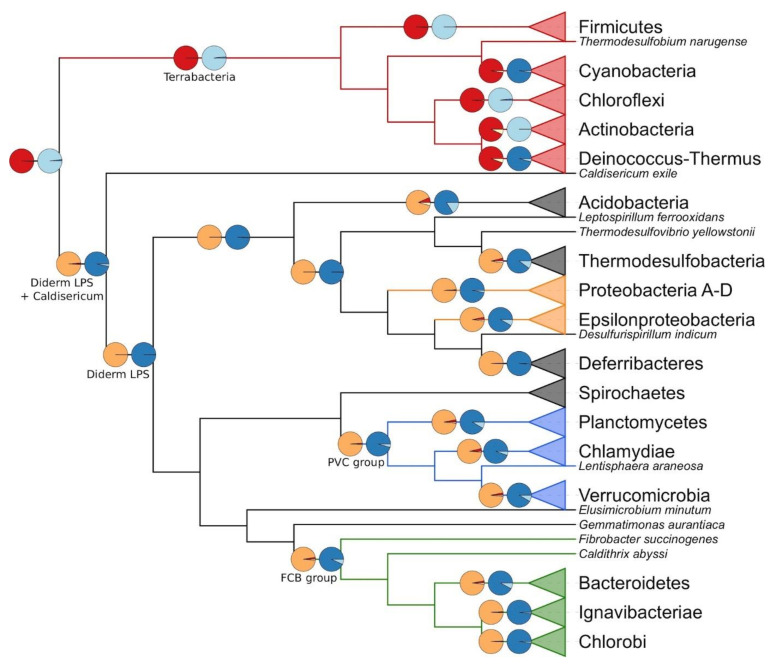
Figure 2.
Cladogram derived from the tree of Figure 1 featuring the cell-wall architecture inferred for selected last common ancestors among Bacteria. Colour key is red = Terrabacteria, orange = Proteobacteria, green = FBC superphylum, blue = PVC superphylum Branches ending with a triangle represent collapsed groups (for details, see Figure 1 or Table S3). The pie chart sectors correspond to the posterior probabilities of the model reverse-jump hyperprior exponential 0 to 100 (R2). Colour key is red = thick PG, orange = thin PG, yellow = no PG, dark blue = diderm, light blue = monoderm.

