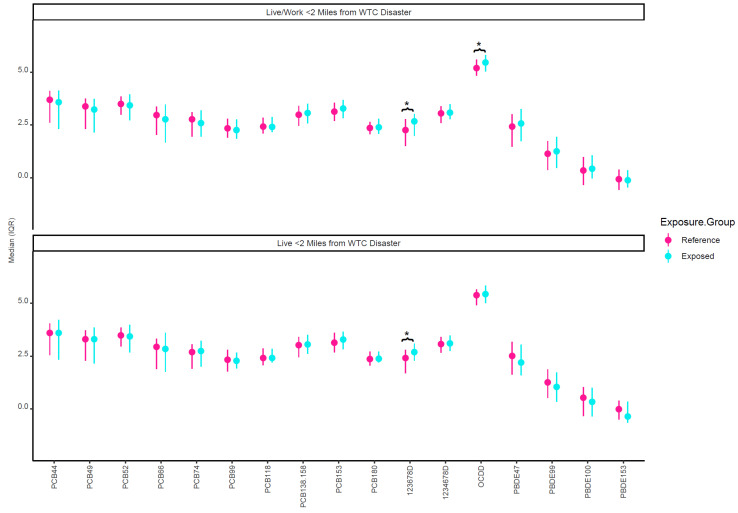
Figure 2.
Unadjusted log-transformed lipid-adjusted prenatal chemical concentrations by WTC proximity exposure variables. * Indicates significant difference between exposure groups (p < 0.05). The reference group in the top half of the figure represents those who did not live or work within 2 miles of the WTC. The reference group in the bottom half of the figure represents those who did not live within 2 miles of the WTC.

