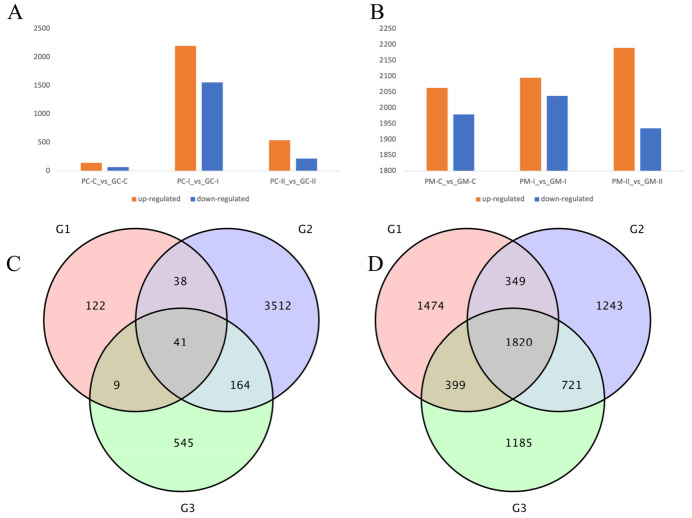
Figure 5.
Gene expression profile of different B. rapa and B. juncea genotypes during different periods of B. rapa (A) and B. juncea (B). (A,B) Number of up- and down-regulated DEGs in each comparison. PC represents the purple B. rapa ‘2217-Pur’, GC represents the green B. rapa ‘2217-Gre’, PM represents the purple B. juncea ‘B90830’, GM represents the green B. juncea ‘2116’, C represents the cotyledon stage, I represents the seedling stage, and II represents the large-leaf stage. (C,D) Venn diagrams of DEGs during the three periods of B. rapa (C) and B. juncea (D). G1, G2, and G3 in (C) represent PC-C_vs_GC-C, PC-I_vs_GC-I, and PC-II_vs_GC-II, and G1, G2, and G3 in (D) represent PM-C_vs_GM-C, PM-I_vs_GM-I, and PM-II_vs_GM-II, respectively. Fold-change ≥ 2 and FDR < 0.01 were used as the criteria.

