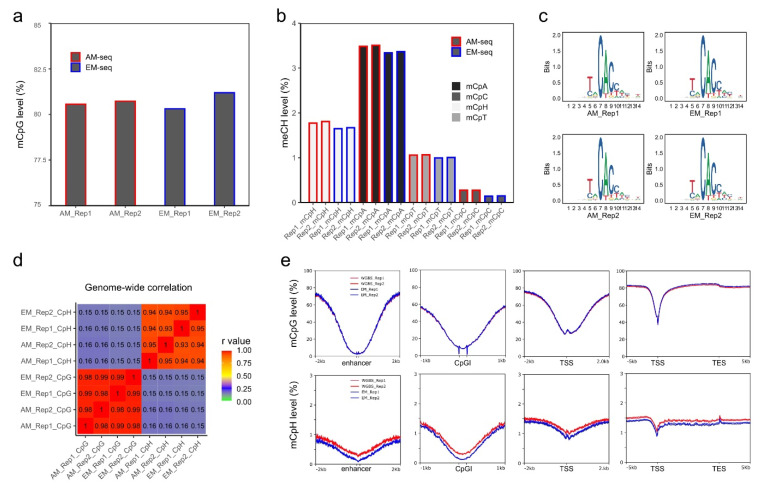
Figure 2.
CpG and non-CpG methylation in NAc D2-MSNs. (a) Global CpG methylation levels calculated from AM-seq and EM-seq libraries. Y-axis starts from 75%. (b) Non-CpG methylation levels. mCpH represents the (methylated CpA, CpT, and CpC)/(total CpA, CpT, and CpC). (c) DNA motif of top hypermethylated non-CpG methylation sites. (d) Pearson correlation of mCpG and mCpH levels of the four methylome libraries using 10 kb bins. (e) Methylated CpG levels and methylated CpH levels at enhancers, CGIs, TSSs, and gene proximal regions using 50 bp bins.

