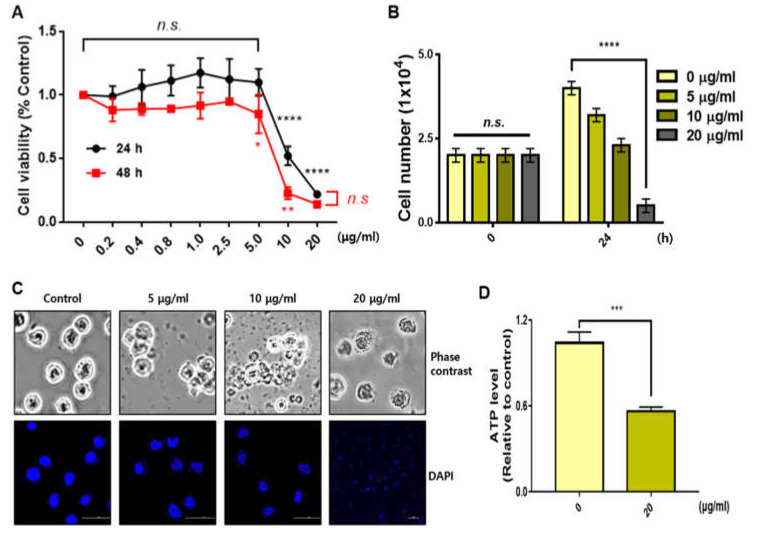
Figure 1.
Distinct cell death effect depending on sBV concentration. (A) THP-1 cells treated with various concentrations of sBV for 24 or 48 h. A total of 10 μg/mL of sBV or more shows the growth inhibitory effect. (B) THP-1 cells counted after staining with trypan blue solution. (C) Morphology of cell death detected in a dose-dependent manner. Cell rupture observed in 20 μg/mL concentration. (D) ATP level was measured using a luminometer after 1 h treatment with 20 μg/mL of sBV. Data are presented as mean ± SD. n.s.—no significance, * p < 0.1, ** p < 0.05, *** p < 0.01, **** p < 0.001 (Student’s t-test).

