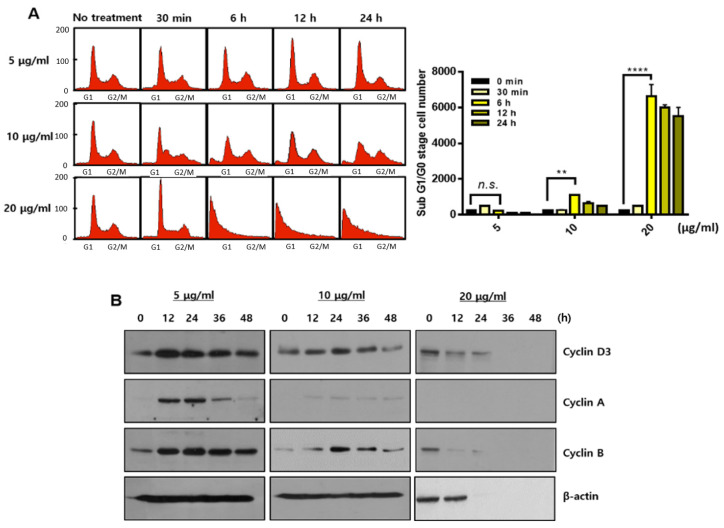
Figure 2.
Changes in cell cycle distribution depending on sBV concentration. (A) FACS analysis performed after sBV treatment and calculated on sub-G1 cells. (B) THP-1 cells treated with the indicated concentration of sBV and western blot analysis performed using cyclin antibodies. Data are presented as mean ± SD. n.s.—no significance, ** p < 0.05, **** p < 0.001 (Student’s t-test).

