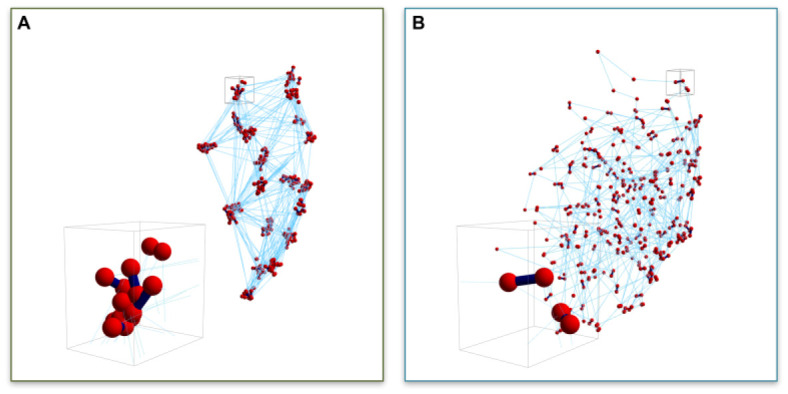
Figure 2.

Snapshots of 3D nucleolus simulations. Bead distributions for (A) ton = 0.09 s and (B) ton = 90 s. Red symbols (spheres) represent bead positions, dark blue segments (lines) represent transient crosslinks between beads both inter- and intra-chain, light blue (thin) lines represent intra-chain neighboring bead connections. Inserts in (A,B) are blow-ups of small volumes around bead clusters. (Figure 7 from [17]). (Reprinted with permission from Ref. [17]. Copyright 2017 Nucleic Acids Research, Oxford University Press).
