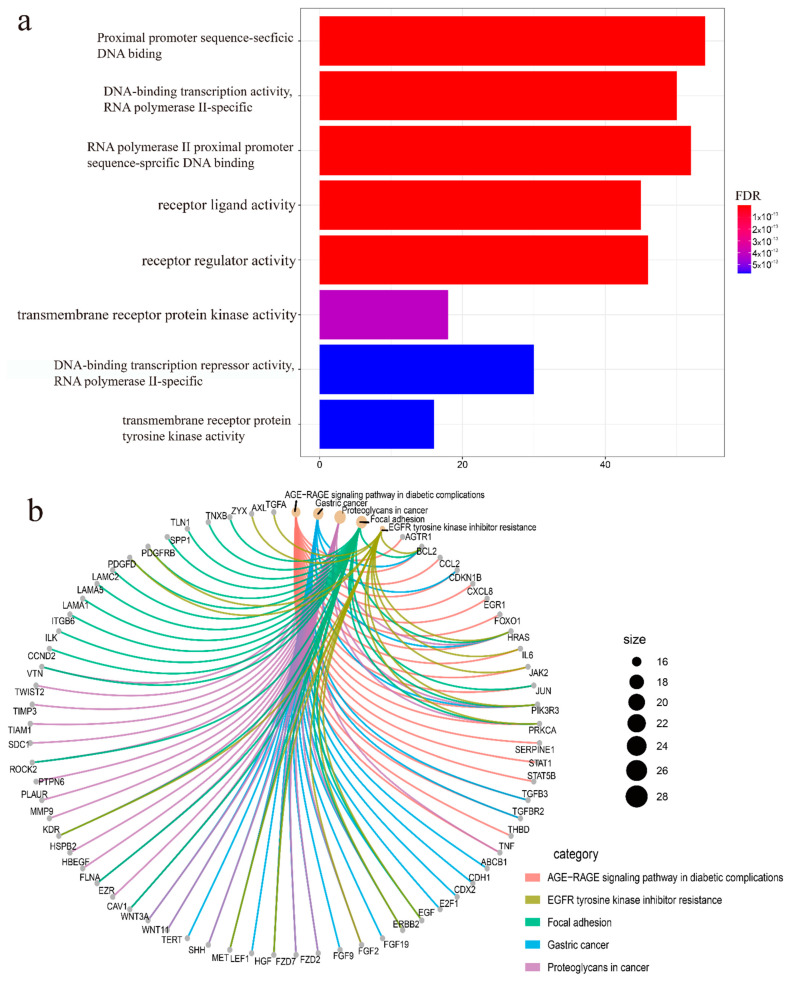
Figure 3.
Enrichment analysis of differently expressed ERGs. (a) Gene Ontology pathway enrichment analysis of biological process among ERGs with a cut-off value p < 0.05, p was adjusted by the method of false discovery rate. (b) KEGG analysis among ERGs with a cut-off value p < 0.05, p was adjusted by the method of false discovery rate.

