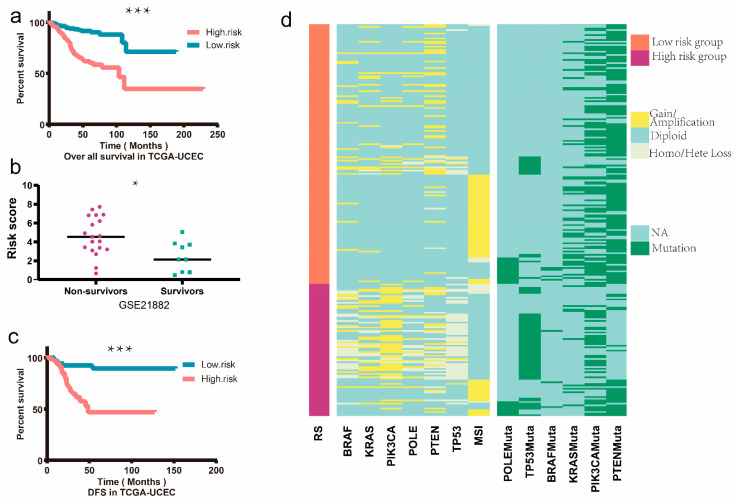
Figure 5.
Survival analysis and heatmap. (a) In the TCGA-UCEC cohort, the 539 patients were divided into a high-risk group and a low-risk group according to the ERGs signature risk score median value, and the overall survival was compared between the two groups through Kaplan–Meier method, as cut-off p set as 0.05. (b) Patients in GSE21882 were divided into non-survivors and survivors after a 5-year follow-up. RS was statistically higher in the non-survivors group by the method of Wilcoxon rank sum test. (c) In the TCGA-UCEC cohort, the disease-free survival was compared in the high-risk group and low-risk group according to the gene signature risk score by the Kaplan–Meier method, as cut-off p set as 0.05. (d) Heat map of TCGA-UCEC patients, an overview of the copy number variation and mutation status of BRAF, KRAS, PIK3CA, PTEN TP53. MSI status was also displayed in the figure. * equals p < 0.05, *** equals p < 0.001.

