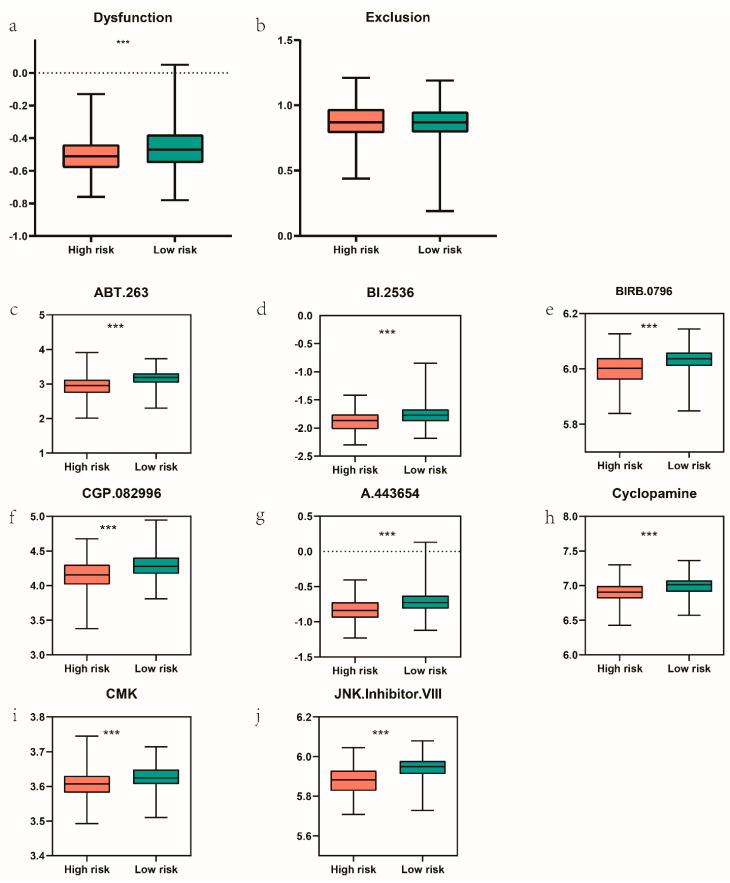
Figure 10.
Immunotherapy and drug sensitivity prediction. (a,b) T cell dysfunction and T cell exclusion in the high– and low–risk patients with TCGA-UCEC. (c–j) Wilcoxon rank sum test was applied for comparing the different chemotherapeutic response predictions in high– and low–risk patients. *** equals p < 0.001.

