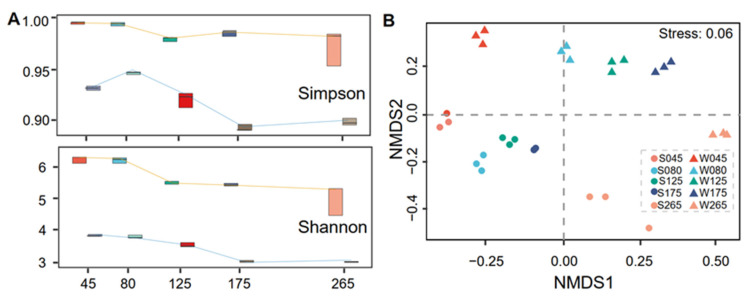
Figure 3.
The biodiversity of the prokaryotic community. (A), The α diversities (Simpson and Shannon index) were analyzed by R package (microeco) and are displayed along a gradient of increasing salinity. The orange and blue lines represent sediment and water groups in salterns, respectively. (B), Non-metric multidimensional scaling (NMDS) was performed to exhibit the β-diversity of the prokaryotic community in salterns.

