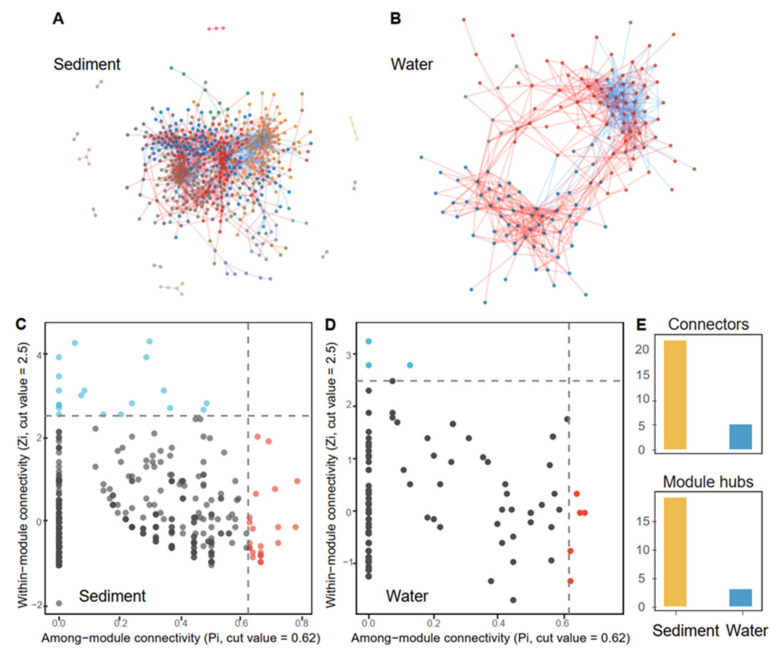
Figure 5.
Salterns networks in sediment and water samples. (A,B), Visualization of the microbial MENs in sediment and water groups. Modules are randomly colored. The red and blue links between nodes represent positive and negative relationships, respectively. (C,D), The role of OTUs in network communities were determined by within-module connectivity (Zi) and among-module connectivity (Pi). The light blue and red points represent module hubs and connectors, respectively. (E), Summary of keystone taxa (including module hubs and connectors).

