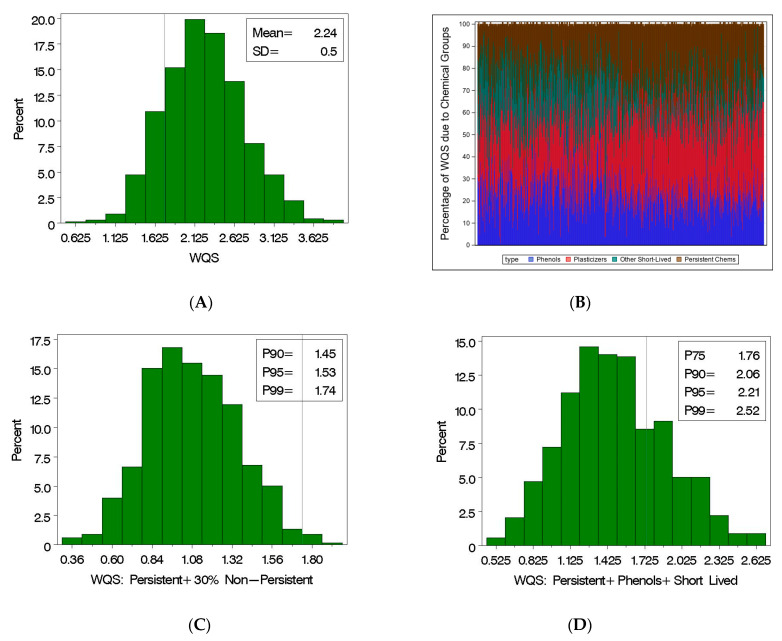
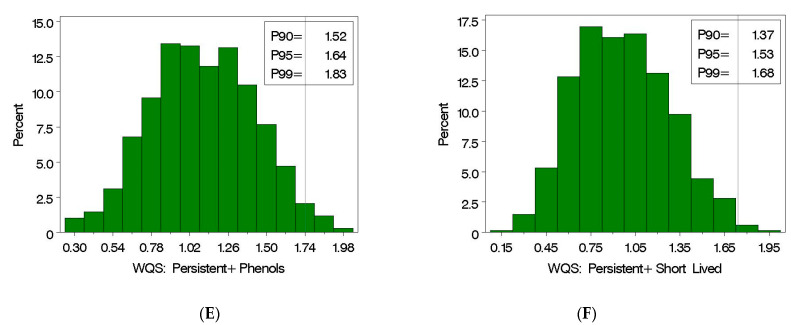
Figure 2.
(A) Histogram of the stratified interaction WQS index in the SELMA cohort with reference line at selected target value (i.e., one SD below the WQS mean), (B) percentage of the WQS index per subject due to persistent chemicals (i.e., PFAS and persistent chlorinated), phenols, plasticizers, and other short-lived chemicals; (C) the distribution of the WQS index due to the persistent and 30% of the non-persistent chemicals, i.e., a 70% cut to non-persistent chemicals; the distribution of the WQS index (D) eliminating the plasticizers, (E) eliminating the plasticizers and the other short-lived compounds, and (F) eliminating the plasticizers and the phenols.


