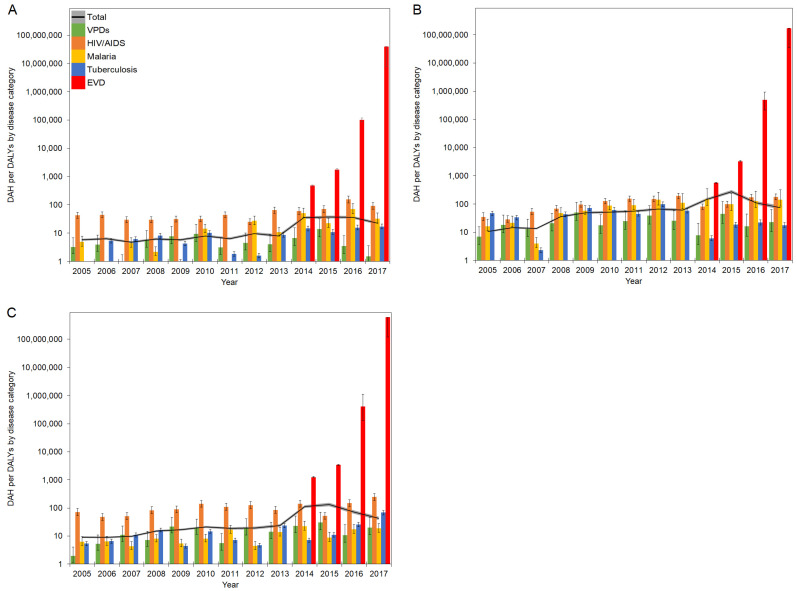
Figure 4.
DAH/DALYs in countries in West Africa in 2005–2017: (A) Guinea; (B) Liberia; (C) Sierra Leone. The black line represents the total DAH/DALYs, and the gray area is extended to the upper and lower 95% confidence intervals based on variations of DALYs. Colored bars represent the DAH/DALYs by disease category. Whiskers extend to the upper and lower 95% confidence intervals based on variations of DALYs. A common logarithmic scale is used on the vertical axis.

