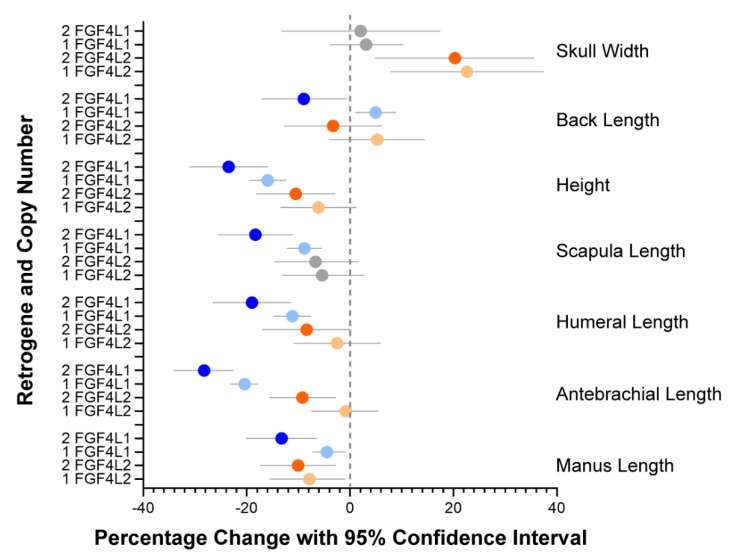
Figure 2.
Measurements significantly affected by FGF4 retrogenes. The mean percentage change and 95% confidence interval in multivariable analysis of the measurements is shown. The dotted line represents the value of 0 copies of either retrogene. Blue color represents statistically significant effects of FGF4L1, and orange color represents statistically significant effects of FGF4L2. Shades of blue and orange represent copy number. Grey symbols were not significant. Complete multivariable results are in Supplemental Table S5.

