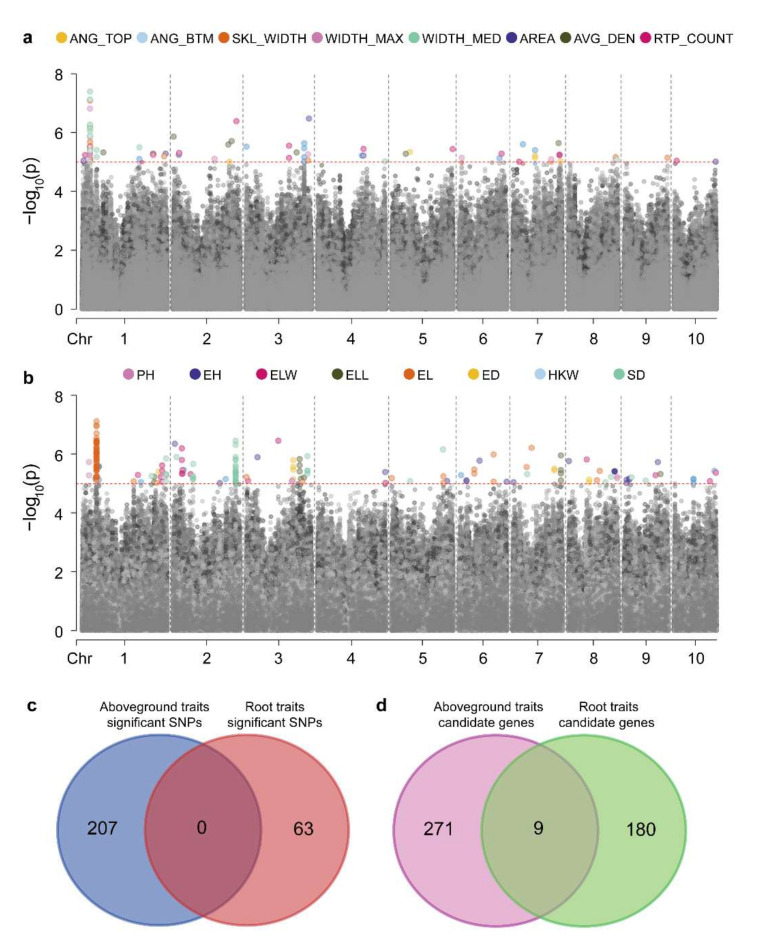
Figure 3.
Genetic correlation between aboveground and root traits. Manhattan map of genome-wide association analysis of (a) root and (b) aboveground traits, the red dotted line shows the threshold (LOD = 5), points below the threshold is gray. (c) SNPs co-located using root and aboveground traits. (d) Genes co-located using root and aboveground traits.

