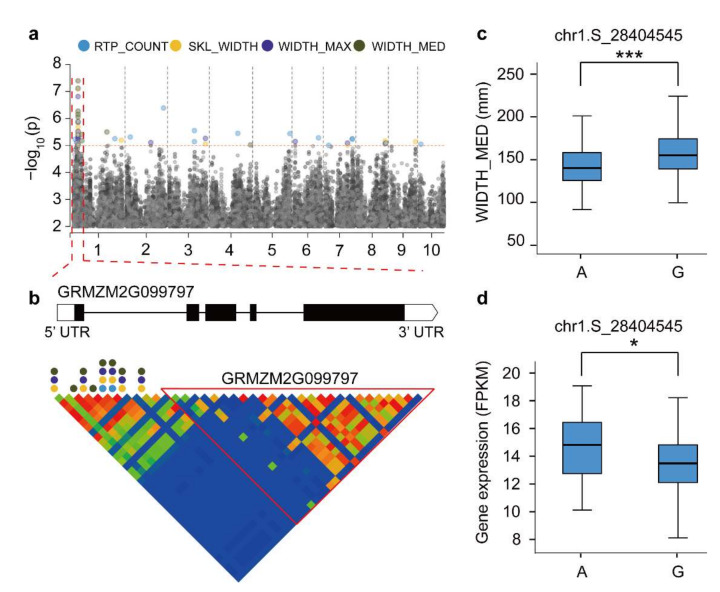
Figure 4.
Linkage analysis of GRMZM2G099797 gene regions and a haplotype material analysis. (a) Manhattan plot of four associated traits. (b) GRMZM2G099797 genetic structure and linkage analysis of gene regions. The circular dots represent SNPs associated with root traits. (c) Differences in WIDTH_MED among various haplotype materials. (d) Differences in gene expression level between different haplotype materials. * Used to mark significance as determined by a t-test: * represents p < 0.05, *** represents p < 0.001.

