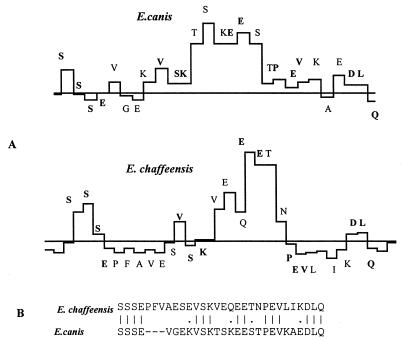
FIG. 7.
Comparison of surface-exposed amino acids in repeat units of the p120s of E. canis and E. chaffeensis. (A) Surface probabilities of amino acids. Boldface letters indicate the amino acids conserved between E. canis and E. chaffeensis. (B) Alignment of the amino acid sequences shown in panel A. Lines represent identical amino acids. Dots represent conserved replacements. Dashes indicate gaps that were introduced for optimal alignment of the amino acid sequences.

