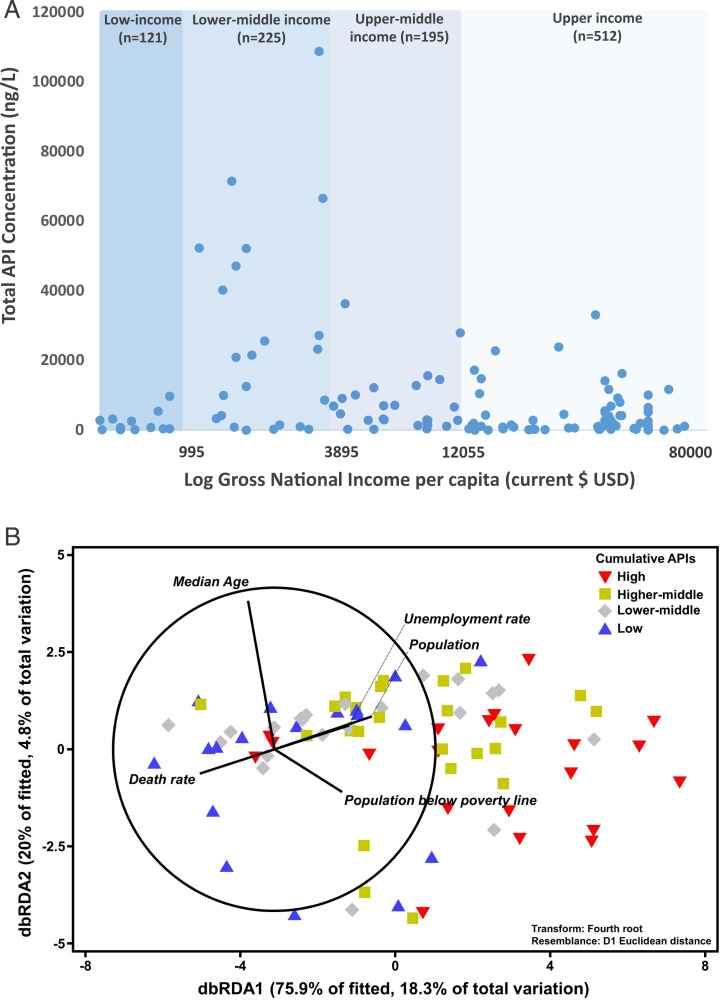
Fig. 4.
(A) Cumulative concentration of APIs (Dataset S6) observed across respective river catchments (signified by a blue dot, n = number of sampling sites) organized by World Bank GNI per capita (33) and (B) distance-based redundancy analysis (dbRDA) illustrating the best model of socioeconomic indicators to explain the measured concentration of different classes of pharmaceuticals in respective countries according to the distance-based linear model (DISTLM, AICc = 325.26, r2 = 0.241). Vector projections with center coordination at (−3, 0) were performed with multiple partial correlation. Length and direction of the vectors represent the strength and direction of the relationship. Data from each country were classified according to their cumulative active pharmaceutical ingredient concentration: that is, Low: first quartile (the lowest 25%); Lower-middle: second quartile (the next 25%); Higher-middle: third quartile (the next 25%); and High: fourth quartile (the top 25%). Raw data can be found in Dataset S9.

