Fig. 1.
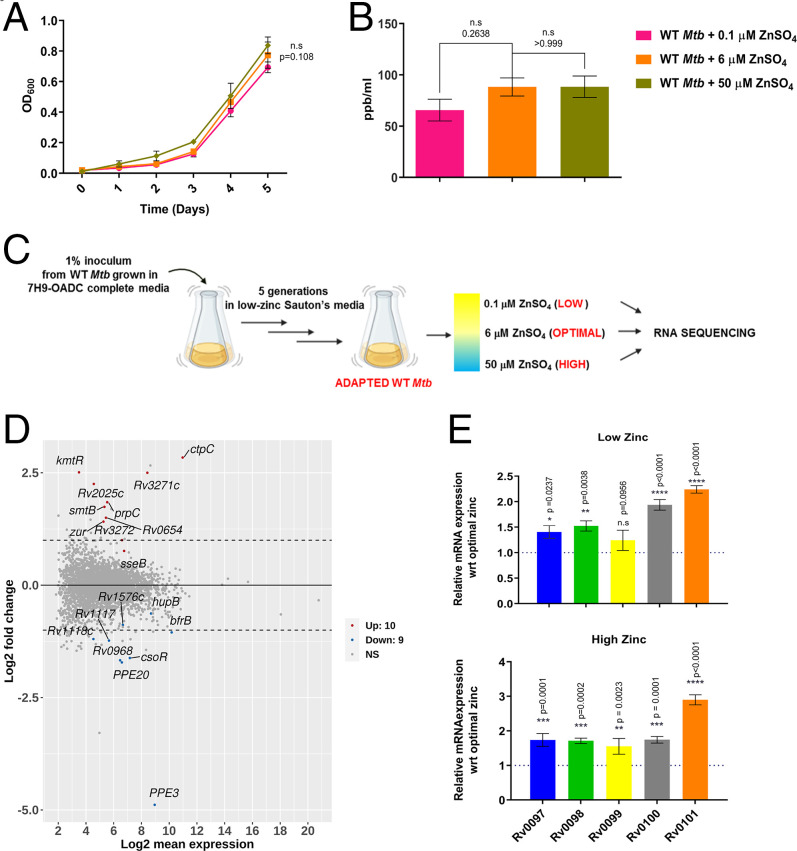
Mtb transcriptional responses maintains zinc homeostasis. (A) Growth kinetics of WT Mtb grown in chelated Sauton’s medium supplemented with varying zinc concentrations: 0.1 μM, 6 μM, and 50 μM. (B) ICP-MS analysis of total intracellular zinc content of Mtb grown in these three conditions. (C) Experimental design for generation of low-metal adapted WT Mtb strain. (D) MA plot of differential gene expression analysis in a 50 μM zinc supplemented condition as compared to 0.1 μM zinc supplementation with log2 fold-change > 0.5 and false-discovery rate < 0.2 as cutoff. Genes marked in red are significantly up-regulated, while genes marked in blue are significantly down-regulated. (E) Gene-expression analysis of Rv0097–Rv0101 through qRT-PCR under low- and high-zinc conditions as compared to optimal zinc concentration. Data represent mean ± SEM (n = 3 biological replicates), P value indicated for each data point.

