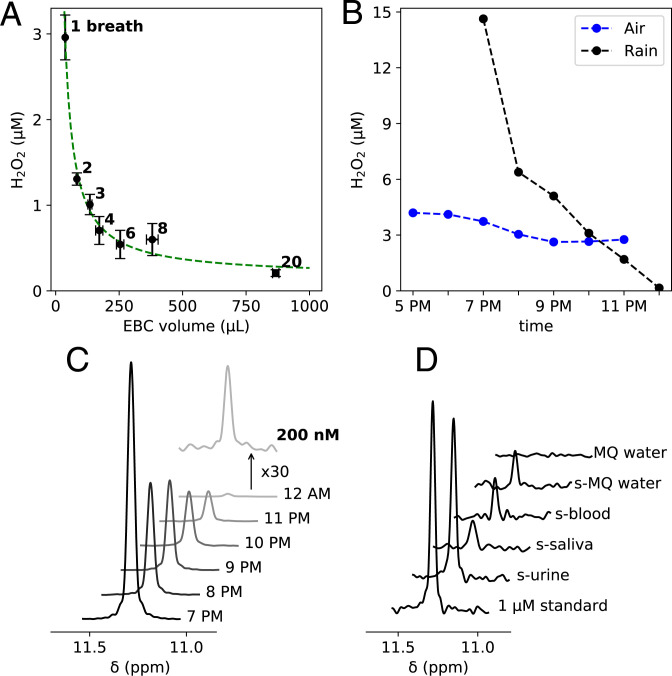
Fig. 1.
NMR detection of H2O2 in various fluids. (A) Dependence of H2O2 concentration in EBC on the collected volume. The green dashed line represents the best fit to Eq. 1. (B) H2O2 levels in rainwater and samples condensed from ambient air on April 24, 2021. (C) NMR spectra of the rainwater samples. (D) NMR spectra of a 1-µM standard sample, sublimed (s-)urine, s-saliva, s-blood, s-MQ water, and MQ water.

