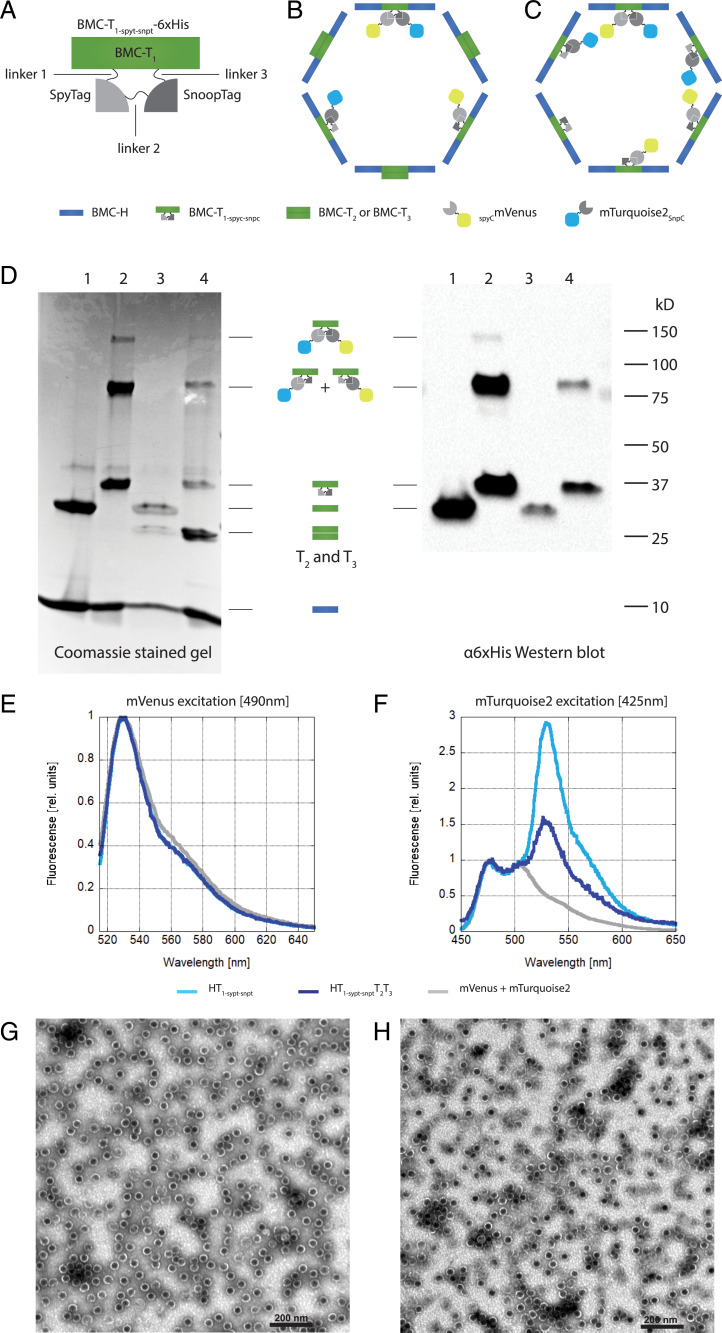
Fig. 2.
Specific encapsulation of two cargo proteins. (A) Schematic of T1-spyt-snpt-6xHis depicting the position of the linkers 1 to 3, the SpyTag, and the SnoopTag. (B) Schematic of a HO-shell wiffleball with T1-spyt-snpt-6xHis T2 and T3 and conjugated cargo mTurquoise2SnpC (blue) and SCmVenus (yellow). (C) Schematic of a HO-shell minimal wiffleball with only T1-spyt-snpt-6xHis and conjugated cargo mTurquoise2SnpC (blue) and SCmVenus (yellow). (D) NiNTA purification of wiffleballs coexpressed with mTurquoise2SnpC and SCmVenus. Lane 1: BMC-H and T1; lane 2: BMC-H and T1-spyt-snpt-6xHis; lane 3: BMC-H, T1, T2 and T3; lane 4: BMC-H, BMC- T1-spyt-snpt-6xHis, T2 and T3. (Left) Coomassie stained SDS/PAGE gel. H T1-spyt-snpt-6xHis and H T1-spyt-snpt-6xHis T2T3 architectures show conjugations between T1-spyt-snpt-6xHis, mTurquoise2SnpC and SCmVenus, either individually (∼80 kD) or together (∼120 kDa). (Right) α6xHis Western blot. T1-spyt-snpt-6xHis contains a 6xHis tag used for detection. Conjugation bands between T1-spyt-snpt-6xHis and the fluorescent proteins can be observed. (E) Fluorescense emission spectrum after mVenus excitation at 490 nm. The emission spectra were normalized to mVenus emission intensity. (F) Fluorescense emission spectrum using mTurquoise2 excitation at 425 nm avoiding mVenus excitation. mVenus emission can be observed in the loaded wiffleballs due to FRET, while this isn’t present when only mVenus and mTurpuoise2 are expressed by themselves without being loaded into the wiffleballs (mVenus+mTurquoise2). Emission spectra were normalized to mTuriquise2 emission intensity. (G) TEM image of H T1-spyt-snpt-6xHis minimal wiffleballs. (Scale bar, 200 nm.) (H) TEM image H T1-spyt-snpt-6xHisT2T3 full wiffleballs. (Scale bar, 200 nm.)

