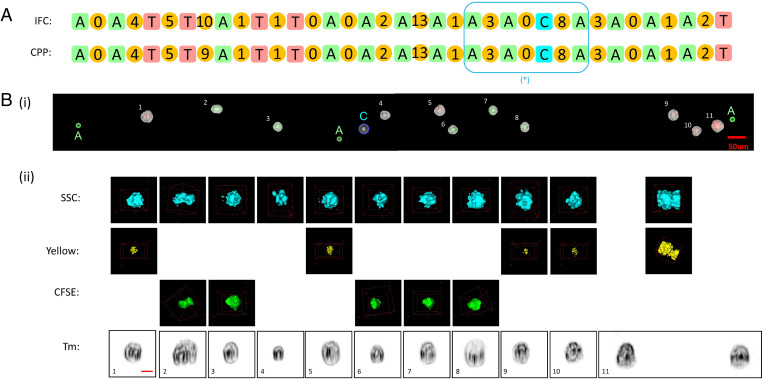
Fig. 4.
Human cancer cell experiment. MCF-7 and HeLa cells were stained with CFSE and CellTrace yellow, respectively, and HEK-293 were unstained. (A) Representative section of the matched sequences from the IFC and CPP readouts. The number between the adjacent marker beads shows the number of cells in between. When the number of cells in two sequences matches, we can unambiguously match the cell with its 3D images. [* indicates section that is expanded in B (i) and (ii)]. (B) A representative section (in the box in A) of cells (i) on the CPP membrane and (ii) having their 3D SSC images and fluorescent images (in yellow and green from CellTrace Yellow and CFSE, respectively) as well as 2D transmission images. Notice that cell 2 appears to be a doublet. Cell 11 shows a doublet in the scattering and fluorescent images, but the 2D transmission image can resolve the doublet from the perspective. CFSE, Cell Proliferation Kit (Ex/Em, 488/517); yellow, CellTrace yellow proliferation kit (Ex/Em, 546/579); SSC, side scattering (90 degrees); Tm, transmission image. (Scale bar, 10 µm.)

