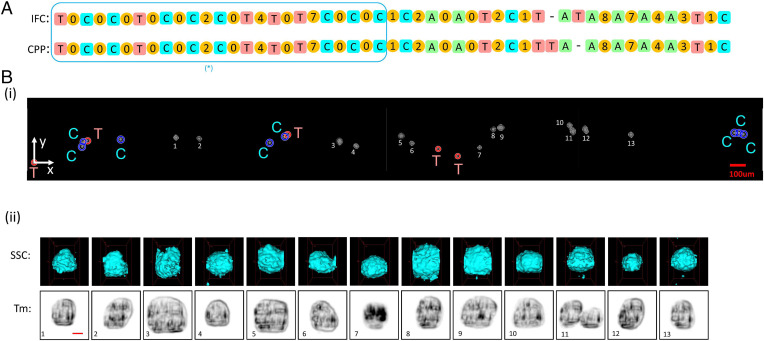
Fig. 6.
Liver cell experiment. (A) Representative section of the matched sequences from the IFC and CPP readouts. The number between adjacent marker beads shows the number of cells in between. When the number of cells in two sequences matches, we can unambiguously match the cell with its 3D images. (B) Details of marker bead and cell images within the highlighted box in A. (i) Low-resolution camera images for marker beads and cells on the membrane filter of CPP. The image resolution is sufficient for the identification of the marker beads and the coordinates of the cells as indicated in Table 1. (ii) High-resolution 3D SSC and 2D transmission images of liver cells from the 3D-IFC. The images can detect cell doublets (cell 11). (Scale bar, 10 µm.)

